Tag Archives: send-xhr-start

Respect The Trends In These ‘Widowmaker’ Trades

“Bull-markets are born on pessimism, grow on skepticism, mature on optimism and die on euphoria.” -Sir John Templeton There are a couple of trends out there in the markets right now that are becoming so-called “widowmakers.” Specifically, I’m referring to oil and long bonds. Oil has been crashing while long bonds have been soaring. Oil is way oversold and long bonds are way overbought. They should both probably retrace a bit of their recent moves simply because they’re both so overextended right now. However… See the massive inflows into the oil ETF in the chart above? That is not the sort of “pessimism” that forms a major bottom. Conversely, in bonds… Investors have been drastically underweight and heavily short bonds for over a year now. This is why I’ve been writing for some time that bonds may be more likely than stocks to see a ” blow off ” sort of move. Now traders are clearly trying to anticipate a trend change in both of these asset classes. They are getting heavily long oil and they remain heavily short long bonds. Now, to be clear, I think they may revert a bit if only to work off their overextendedness (if that’s even a word). But the big problem with these trades is that the trend is plain as day and traders shouldn’t forget, “the trend is your friend!” Oil is nowhere close to breaking out of its downtrend and long bonds are nowhere close to breaking down out of their uptrend. Trying to anticipate these trend changes must have been inordinately painful for these traders over the past few months. And the odds are neither of these trends will actually change until we see some real despair in oil and some true euphoria in long bonds, as witnessed in ETF flows or some other similar indicator. At least, that’s what I imagine the brilliant Sir John would have told us. How did this change your view of ? More Bullish More Bearish It Didn’t This impact ( ) More Bullish More Bearish Unchanged Thanks for sharing your thoughts. Submit & View Results Skip to results » Share this article with a colleague

Transport ETFs Jolted By Weak UPS Earnings Forecast

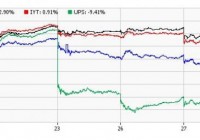
With the economy growing at the fastest clip in over a decade and the oil price at a five-year low, transportation was one of the best performing sectors of 2014. This trend continued in 2015 driven by solid retail, manufacturing, and labor data that created strong demand for the movement of goods across many economic sectors. Additionally, strong earnings from major players in the industry are fueling growth in the sector. However, the space was badly hit by the recent profit warning and sluggish outlook from the bellwether United Parcel Service (NYSE: UPS ) on January 23 that dampened investors’ mood making them cautious on the stock and the broad sector. UPS Warns of Soft Q4 Earnings The world’s largest package delivery company said that higher operating expenses and temporary hiring for the peak holiday season might take a toll on the earnings for the fourth quarter and full-year 2014. It is slated to release its fourth quarter earnings on February 3. The company now projects earnings for Q4 to come in at $1.25 per share, missing the Wall Street’s expectations of $1.47. Accordingly, the Zacks Consensus Estimate moved down to $1.25 from $1.47 over a period of seven days. United Parcel also slashed its full-year guidance to $4.75 per share, much below the previous expectation of $4.90-$5.00 a share and the current Zacks Consensus Estimate of $4.77. The Zacks Consensus Estimate has declined 21 cents over the past 7 days. Weak 2015 Guidance Further, the company expects 2015 earnings to grow slightly less than its long-term growth target of 9-13% due to increased pension costs and currency headwinds. The Zacks Consensus Estimate currently represents growth of 7.85% for this year. Market Impact The news has spread bearishness not only on this package delivery giant but also on the broad space. UPS shares dropped as much as 10% on Friday after this bearish announcement and are down nearly 11.7% over the past three days. Its major rival FedEx (NYSE: FDX ) fell 4.1% over the past three sessions. The sluggish trading has also been felt in the ETF world as both the transport ETFs – the iShares Dow Jones Transportation Average Fund (NYSEARCA: IYT ) and the SPDR S&P Transportation ETF (NYSEARCA: XTN ) – lost 2.3% and 1.2%, respectively, in the same period. What Lies Ahead? Despite the slide and UPS’ sluggish outlook, investors shouldn’t completely write off transportation ETFs from their holdings. This is because the funds have spread out exposure to a number of firms in various types of industries like railroads, airline and low cost trucking suggesting that the space can easily counter shocks from some of the industry’s biggest components. In fact, IYT puts about 47% in railroads while airfreight & logistics makes up for nearly 27% share. Meanwhile, XTN is heavily exposed to trucking and airlines as these make up roughly 62% of the total while air freight & logistics accounts for 21% share. In terms of individual holdings, the iShares product is heavily concentrated on the top firm – FedEx – at 11.65% while UPS takes the fourth spot at 6.71%. On the other hand, State Street fund uses an equal weight methodology for each security. While IYT is more popular and liquid among the two, XTN is cheap by 8 bps. Further, FedEx reaffirmed its EPS guidance of $8.50-$9.00 for fiscal 2015 on the heels of UPS’ warnings. The midpoint is well above the Zacks Consensus Estimate of $8.94, indicating sound business for the transport ETFs. If these were not enough, cheap fuel will provide a big-time boost to transport earnings growth. This has already started to reflect in the latest earnings results as earnings for the transport sector reported so far is up 20.6% with a beat ratio of 57.1% and median surprise of 3.3%.

Value Investing: Have You Been Using The Wrong Quality Ratio?

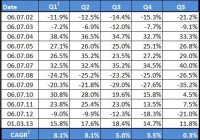
By Tim du Toit Do you think adding a company quality ratio to your investment strategy can make a difference to your returns? As you know we are skeptical, as our experience testing quality ratios in the research paper Quantitative Value Investing in Europe: What Works for Achieving Alpha was mixed. What doesn’t work We found that Return on invested capital (ROIC) and return on assets (ROA) weren’t good predictors of returns. Even though high-quality companies did do better than low-quality companies (low ROIC and ROA) returns did not increase in a linear way as you moved from low-quality to high-quality companies. And if you only invested in high-quality companies, it would not have helped you to consistently beat the market. A better quality ratio? Our thinking on quality ratios changed when we read a very interesting research paper called The Other Side of Value: The Gross Profitability Premium by Professor Robert Novy-Marx in which he defined a company quality ratio performed as well as a valuation ratio. How calculated Professor Novy-Marx defined a quality company as one that had a high gross income ratio (let’s call it Quality Novy-Marx ), which he calculated by dividing gross profits by total assets . He defined gross profit as sales minus cost of sales and assets simply total assets as shown in the company’s balance sheet (current assets + fixed assets). Does it work? In the paper Professor Novy-Marx shows that this simple ratio has about the same predictive return value as the price to book ratio in spite of companies with a high gross income ratio (Quality Novy-Marx) being a lot different if you compare them to undervalued companies with a low price to book ratio. Companies with a high Quality Novy-Marx ratio generated significantly higher average returns than less profitable companies in spite of them, on average, having a higher price to book ratio (more expensive) and higher market values. Because value (low price to book) and profitability (high Quality Novy-Marx ratio) strategies’ returns are negatively correlated (the one goes up when the other goes down), the two strategies work very well together. So much so that Professor Novy-Marx in the paper suggests that value investors can capture the full high-quality outperformance without taking on any additional risk by adding a high quality strategy to an existing value strategy. If you do this he found that this reduces overall portfolio volatility, in spite of it doubling your exposure to the stock market. We also tested it We of course also wanted to test if the Quality Novy-Marx ratio works on the European stock markets. Our back test (on European companies) over just less than 12 years from July 2001 to March 2013 came up with the following result: Source: Quant-Investing.com 1 Quintiles 2 Compound Annual Growth Rate ( OTCPK:CAGR ) As you can see the results are (apart from Q1 to Q2) linear, which means as you move from low-quality companies (Q5) to high-quality companies (Q1) returns increase every time. Also high quality companies (Q1) did substantially better than low-quality companies (Q5). This clearly shows that the Quality Novy-Marx ratio is a very good ratio to add to how you search for investment ideas. Substantially outperformed the market High-quality companies also substantially outperformed the index. The STOXX Europe 600 index over the same period had a compound annual growth rate of -0.82%, worse than even the worse quintile, most likely because of the banks being included in the index (not in the back test universe because you cannot calculate the Quality Novy-Marx ratio for them). In summary From these two back tests you can see that adding quality companies, defined as companies with high gross profits to total assets can definitely add to your investment returns. We have not tested it but Professor Novy-Marx mentions that if you are a value investor, quality companies have the ability to increase your returns and decrease the volatility of your portfolio. But if you add this quality ratio to your screens, you will find companies that are not undervalued, which is something that value investors will have to get used to. Where can you find it? In the screener you can select the gross income ratio (called Gross Margin (Marx)) as a ratio in one of the four sliders as shown below. Or you can select the Gross Margin (Marx) as a column in your screen which will allow you to filter and sort the Gross Margin (Marx) values.