Tag Archives: send-xhr-start

Portfolio Update: Buying More PMs

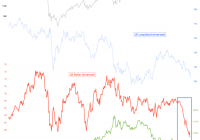
Please note that this post is a little outdated due to the recent holiday break. Usually, I try to update the trades opened within the 24 hours from execution, but in recent times I haven’t been anywhere near the office (apart from an hour here or there). I did open two new trades just before New Year’s eve, so here is the update as well as a brief thinking process. Chart 1: Gold has shown incredible relative strength during the USD rally! Source: Short Side of Long Unless you have been living in a cave or under a rock, you surely would have noticed the amazing strength the U.S. Dollar has been showing in recent months. Whether it’s against the majors like the Euro, the Yen or the Australian dollar, or EM currencies such as the Ruble or Real, the greenback has been making up some serious ground. If we observe Chart 1, we should be able to see four major global macro asset classes: S&P 500, Treasury Long Bond, USD Index and Gold. Let us not focus on the stock and bond market for a second, and only pay attention to the recent action in the U.S. Dollar (inverted on the chart) and Gold. Majority of the time, negative correlation between the USD and Gold is high. So in plain English, usually but not always, Gold moving up means the U.S. Dollar is moving down, and vice versa. What should grab all of our attention is how powerful the recent USD rally has been and yet Gold has held its own (observe the blue box in Chart 1). Chart 2: Price is compressed in a technical triangle and it’s decision time Source: Short Side of Long The fact that Gold has barely sold off and still remains above $1,200 per ounce, at a similar price where it traded 18 months ago, indicates relative strength and buying interest. Other commodities, such as Crude Oil, have not been as lucky with greenback moving up so high. Eventually the U.S. Dollar rally will pause and take a breather, because nothing can keep rising vertically forever. It is my view that Gold will outperform when that time comes. Now… most trades would like to know when that will happen. Because I do not have a crystal ball, I cannot answer that question like other so-called “experts.” But what I can say is that the current price action in Gold shows a major compression in the form of a technical triangle. This pattern is edging closer and closer to a break in either direction, which should give us further clues (refer to Chart 2). I believe this break will be on the upside and I recently purchased some Gold via the SPDR Gold Trust ETF ( GLD). Depending on how the price behaves, this could either just be a short-term trade or a longer-term investment. Chart 3: Miners have been terrible performers since 2011 and appear cheap Source: Short Side of Long Furthermore, Gold Miners have become extremely oversold and now trade at dirt-cheap valuations. When compared to the Gold price itself, miners trade at the biggest discount since 2000… around the time the last major precious metals bull market started (please see Chart 3). This is even more true when we look at the Market Vectors Junior Gold Miners ETF ( GDXJ), which is down by almost 89% from the highest high in late 2010. I’ve started a small position here to test the waters (similar to Russia and Uranium if you refer to Chart 4). Also worth an important mention, I have closed my major hedge on Silver, which was originally opened in early July of 2014 just above $21 per ounce. This was one of my biggest trades in recent times and a gain of 24.5% is really, really huge. I plan to use these profits to purchase more PMs and average down my previous positions, which sit underwater. Moreover, despite a huge rally in the U.S. Dollar, I will continue to hold all my cash in this currency for the time being. My shorts on the Aussie Dollar also remain in place for now. Finally, the only other position I have opened recently is the Chinese H shares bet, but more on that in another post. Chart 4: Recent additions to the portfolio are PMs and Chinese stocks Source: Short Side of Long Disclosure: Biggest trades in the portfolio are long Precious Metals, long Chinese equities, short Australian Dollar and finally cash held in U.S. Dollar currency. Link to the original article on The Short Side Of Long
A New One Of A Kind Biotech ETF Hits The Market

Summary LifeSci Index Partners has just launched the BioShares Biotechnology Clinical Trials ETF. This ETF focuses on just those biotech firms with a primary product offering that is in a Phase 1, Phase 2 or Phase 3 clinical trial stage of development. Given that these companies have no current product sales, many of the stocks in this portfolio are essentially boom or bust propositions. This fund is the only one in the ETF universe that offers exclusive focus to these clinical trial firms. Biotechnology stocks have soared this past year – the iShares Nasdaq Biotechnology Index Fund (NASDAQ: IBB ) returned an impressive 34% in 2014 – so it’s not surprising that companies are stepping up their biotech offerings in order to take advantage of current demand. One of those offerings that hit the market in just the last week is attempting to differentiate itself by targeting a very unique niche of the market. The BioShares Biotechnology Clinical Trials ETF (NASDAQ: BBC ) invests in biotech firms with a primary product offering that is in a Phase 1, Phase 2 or Phase 3 clinical trial stage of development. According to the fund’s fact sheet: Clinical trials stage companies are typically younger, smaller companies which do not have a drug approved but instead focus on testing their experimental drug candidates in human clinical trials. While many biotech focused ETFs invest in these types of firms, this is believed to be the only ETF out there that focuses on these types of companies. Most biotech ETFs tend to be more heavily weighted towards the big established names. In the aforementioned iShares Biotechnology Index Fund, every one of the top nine holdings in the ETF which happens to include over 53% of the ETF’s total assets fall into the Large Growth Morningstar style box. These top holdings include titans like Biogen (NASDAQ: BIIB ), Celgene (NASDAQ: CELG ) and Amgen (NASDAQ: AMGN ). That’s fine if you want broad exposure to the biggest and baddest names in the sector but it doesn’t do you much good if you want to invest in the little guys who are trying to break out in the sector or have a promising new drug in the pipeline. Researching and investing in these names individually can be cumbersome, costly and very risky. Being able to invest in a broad basket of these types of companies (the fund has 68 holdings in all) represents a niche that could really appeal to investors. Top holdings in this ETF currently include Sage Therapeutics (NASDAQ: SAGE ), Infinity Pharmaceuticals (NASDAQ: INFI ) and Prothena (NASDAQ: PRTA ). The fund is still in its infancy but initial signs are positive. The fund has a mere $3M in assets, but it does trade around 35,000 shares a day currently, so liquidity is slowly becoming less of an issue. Plus, investors need to consider the risk in an ETF such as this. Given that these companies have no actual product sales and just experimental drugs in the pipeline, they’re essentially boom or bust propositions and should be considered risky. Conclusion It’s easy to trade individual stocks when they’re well followed and well researched but an ETF is perfect for a niche product such as this. The 0.85% expense ratio isn’t particularly onerous considering you’ve got biotech specialists managing the product for you. Given biotech’s current popularity and the fact that there doesn’t appear ETF offering exclusive exposure to these clinical trial firms, this ETF should have some success carving out a special niche for investors. Now that you’ve read this, are you Bullish or Bearish on ? Bullish Bearish Sentiment on ( ) Thanks for sharing your thoughts. Why are you ? Submit & View Results Skip to results » Share this article with a colleague

Revisiting The ‘Problem’ With Leveraged ETFs

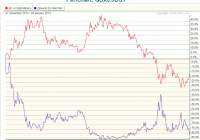
Editor’s note: Originally published at tsi-blog.com on January 6, 2015. My 3rd November blog post explained why leveraged ETFs should only ever be used for short-term trades. To set the scene, here is an excerpt from this earlier post: The crux of the matter is that leveraged ETFs are designed to move by 2 or 3 times the DAILY percentage changes of the target indexes. They are NOT designed to move by 2 or 3 times the percentage change of the target indexes over periods of longer than one day. Due to the effects of compounding, their percentage changes over periods of much longer than one day will usually be less – and sometimes substantially less – than 2-times (in the case of a 2X ETF) or 3-times (in the case of a 3X ETF) the percentage changes in the target indexes. In the earlier post, I presented tables to show that the greater the volatility of an index and the greater the leverage provided by an ETF linked to the index, the worse the likely performance of the leveraged ETF over extended periods. The worse, that is, relative to the performance superficially implied by the daily percentage change relationship between the index and the leveraged ETF. I concluded that leveraged ETFs are only suitable for short-term trades and that a trade should be very short term if it involves a 3X ETF and/or a volatile market. To illustrate how badly a leveraged ETF can perform relative to the performance superficially implied by the daily percentage change relationship between the leveraged ETF and the market to which it is linked, here is a chart comparing the performances of the Market Vectors Junior Gold Miners ETF ( GDXJ) and the Direxion Daily Junior Gold Miners Index Bear 3X Shares ETF ( JDST) since the end of 2013. JDST is designed to have a daily percentage change that is roughly three times the INVERSE of GDXJ’s daily percentage change, so it is an ETF that someone would buy if they were bearish on GDXJ. For example, on a day when GDXJ lost 5%, JDST would gain about 15%, and on a day when GDXJ gained 5%, JDST would lose about 15%. Given that GDXJ is presently about 15% lower than it was at the end of 2013, people who are unfamiliar with how leveraged ETFs work would likely jump to the conclusion that a JDST position purchased at the end of 2013 and held through to the present would show a healthy profit. However, this conclusion could not be further from the truth, because JDST has lost 81% of its value over the period in question. The dismal performance of JDST is a trap for the novice trader, but it is not a design flaw. As outlined in my 3rd November post, it is a mathematical function of how the leverage works and simply means that this type of ETF should only ever be used in trades with time frames of no more than a few weeks. Now that you’ve read this, are you Bullish or Bearish on ? Bullish Bearish Sentiment on ( ) Thanks for sharing your thoughts. Why are you ? Submit & View Results Skip to results » Share this article with a colleague