Tag Archives: send-xhr-start

Relative Rotation Shows U.S. Equities Are The Place To Be

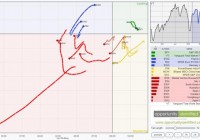
RRG charts help us focus on those areas of the investment universe that deserve it. This article looks at the relative strength of the world’s largest markets, using the total world ETF from Vanguard as our benchmark. If you are looking to invest in stocks, the U.S. is still the best place (at this time) to be. We live in the golden age of investing. Never before have individual investors had so much available to them for gaining investment knowledge, finding great investment opportunities, and the ability to take advantage of them at such a low cost. Our parents could only dream of having investment communities like Seeking Alpha, investment blogs like ours , almost limitless fundamental information online, and technical analysis tools only one click of a mouse (“what’s that?” says your grandpa) away. And with the advent of ETFs, common investors can invest in pretty much whatever and wherever they want. Want to buy timber? Go for it. There’s an ETF for that, the iShares S&P Global Timber & Forestry Index ETF ( WOOD). How about palladium? Got you covered with the ETFS Physical Palladium Shares ETF ( PALL). Want to invest in foreign markets like South Korea? Be my guest, the iShares MSCI South Korea Capped ETF ( EWY). Do you really like coffee? Try the iPath Dow Jones-UBS Coffee ETN ( JO). With sugar? Sure, the Path Dow Jones-UBS Sugar Total Return Sub-Index ETN (NYSEARCA: SGG )! Investors today have the investment world at their fingertips. In this week’s RRG™ analysis, we’re going to look at the relative strength of the world’s largest markets, using the Vanguard Total World Stock ETF (NYSEARCA: VT ) as our benchmark. Basically, we want to see where in the world we should be focusing our attention. Accordingly, the following ETFs representing most of the world’s largest stock markets will be compared against VT: SPDR S&P 500 Trust ETF ( SPY) Vanguard Total Stock Market ETF ( VTI) iShares MSCI Canada ETF ( EWC) iShares MSCI France ETF ( EWQ) iShares MSCI Germany ETF ( EWG) iShares MSCI Italy Capped ETF ( EWI) iShares MSCI Spain Capped ETF ( EWP) SPDR EURO STOXX 50 ETF ( FEZ) PowerShares India Portfolio ETF ( PIN) S PDR S&P China ETF ( GXC) iShares MSCI China ETF ( MCHI) iShares MSCI South Korea Capped ETF ( EWY) iShares MSCI Hong Kong ETF ( EWH) iShares MSCI Japan ETF ( EWJ) iShares MSCI Australia ETF ( EWA) Market Vectors Russia ETF ( RSX) Generally speaking, when looking at the ETFs above in the RRG™ below, those in the green leading quadrant are what you want to own; those within the yellow weakening quadrant should be on your watch-list (as they might be deteriorating), those within the red lagging quadrant should be avoided and those in the blue improving quadrant should be on your shopping list. In the RRG™ below, the long tails represent the movement of each country’s ETF over the past 10 weeks in comparison to the world ETF, VT. So what do we see? The first thing to notice is the chart of VT in the upper right corner. Global stocks as a whole are down since July. Accordingly, when we analyze this chart, we want to be cognizant of the fact that maybe stocks as a whole are not where we want to be. That being said, if we are looking for stock opportunities, we see that we should be in the U.S. (SPY and VTI have been leading the last 10 weeks) and looking for potential opportunities in Germany, France, and Europe as they have moved from lagging to improving over the past 10 weeks. And finally, we should also look to China as they are subtly rotating from weakness towards leading. In conclusion, if we have to be in stocks, we should be in the United States and looking for potential opportunities in Germany, France, Europe, and China. [1] Note: The terms “Relative Rotation Graph” and “RRG” are registered trademarks of RRG Research . (click to enlarge)

Cyber Warfare Risk: What Are The Investment Impacts?

by Ron D’Vari The devastating cyber-attack against Sony and its allegedly state-sponsored origins raises several key questions with respect to the security risk for the global financial system. For example: Should investors be worried about advanced threats on the global financial system by cyber terrorists and/or state-sponsored adversaries to destabilize the global economy and markets? Could there be attacks on the Federal Reserve, the U.S. Treasury or one or more mega banks of a magnitude that would destabilize the U.S. dollar and prompt a global stock market collapse? Do U.S. monetary and fiscal policies render this type of cyber threat potentially more devastating? In what ways could the cyber-threat to the financial system affect the relative attractiveness of “real assets” (real estate, physical commodities, infrastructure investments, etc.) vs. “financial assets” (enterprise value-related assets)? U.S. intelligence agencies as well as major companies are gradually waking up to the critical nature of cyber security to systemic financial stability. Indeed, the financial services industry has already recognized it can no longer work in isolation, marked by the formation of a member-owned non-profit entity, the Financial Services Information Sharing & Analysis Center (FS-ISAC), to provide resources for cyber and physical threat intelligence analysis and to share information about hackings. The U.S. government has not yet developed a unified approach to help companies coordinate a response to an attack and share information. Complications and lack of coordination in the Sony case made that obvious. As a result, the government is expected to sharpen its focus on this. Companies and government agencies will be investing large sums of money in innovative encryption and firewall solutions to make data, Internet and payment systems safer. Cyber war games have already been created as a way to test a company’s response to cyber incidents. The net effect will be positive for investments in the cyber security industry, but may also lower the overall profitability and productivity of the economy in aggregate. Financial advisers have already been warming to real assets as stock market volatility has picked up and demand for a long stream of cash flows by pension funds has increased. With increasing incidents of cyber-attacks, the trend is expected to continue. There will naturally be a slew of litigations in high-profile data breaches and operation interruptions. These will include claims by employees, customers, suppliers and shareholders. Shareholders can sue if a breach affects share values and future financial streams. Now that you’ve read this, are you Bullish or Bearish on ? Bullish Bearish Sentiment on ( ) Thanks for sharing your thoughts. Why are you ? Submit & View Results Skip to results » Share this article with a colleague

American Electric Power Retains Attractiveness For Dividend Seekers

Summary AEP could sell competitive energy operations if weakness continues to persist in the segment’s performance despite long-term pricing agreements. AEP’s capital expenditures will fuel rate based and bottom-line growth in coming years. Stock’s dividend yield of 3.6% is backed by its cash flows. American Electric Power (NYSE: AEP ) has remained an admired investment option for dividend-seeking investors due to its high dividend yield, which is backed by its cash flows. Also, the company is expected to experience healthy earnings growth in the future, driven by capital expenditure that AEP is making to expand its transmission operations. The company expects to experience regulated rate base growth of 7.5% on average until 2017. Separately, AEP has been considering several options to address challenges faced by its competitive energy operations, including the sale of competitive assets, which will positively affect its bottom-line numbers growth. Earnings growth due to the expansion of regulated energy operations will improve bottom-line growth, and hence strengthen cash flows, which will support dividend growth for AEP in the coming years. Therefore, I believe AEP will deliver a healthy financial performance in 2015, which will positively affect the stock price. Healthy Growth Outlook AEP has made the correct strategic decision to address challenges faced by the company in the competitive energy segment; the company’s competitive energy operations have been adversely affected due to low and volatile forward power prices. AEP is looking for a reliable long-term price agreement to stabilize revenues for the segment. And if the long term pricing agreement does not help AEP address challenges faced by the segment, I believe the company will choose to sell its competitive energy assets. The company recently announced that Goldman Sachs will assist AEP in considering options for its competitive energy operations. AEP’s director of external communication, McHenry said, “We haven’t made a decision about whether or not we’re going to sell them, we’re looking at a variety of options.” Duke Energy (NYSE: DUK ) and PPL Corp. (NYSE: PPL ) are among the leading U.S. utility companies that have sold their competitive energy assets due to the ongoing challenges. Along with its efforts to improve competitive energy operations, AEP has been making capital expenditures to grow it regulated operations, which will improve its top and bottom-line growths in the future. The following table shows the capital expenditures that AEP expects to incur from 2015-2017. 2015 2016 2017 Capital Expenditure ($ -billions) $4.4 billion $3.8 billion $3.9 billion Source: Yahoo Finance Also, the company’s regulated rate base growth is expected to increase at an average rate of 7.5% until 2017, due to the capital expenditures it has been making. The increase in regulated operations will also positively affect the stock price. The following chart shows the rate base growth for AEP from 2013-2017. Source: Company Reports Also, the company has been focusing on reducing its costs. AEP has been working to manage and reduce its operational and maintenance costs, which will help offset the weak results of competitive energy operations and support its long-term bottom-line growth. EPS growth for the company is expected to remain in a range of 4%-6% in the long term, as shown below in the chart. Also, the company is expecting its operating earnings for 2014 to in a range of $3.40-$3.50 per share. Source: Company Reports Healthy Dividends The company has been sharing its success with shareholders through dividends. The company offers a dividend yield of 3.60%, which is backed by its cash flows. Also, the company has consistently increased dividends at an average rate of 4% from 2005-2014. The following chart shows the dividend increases for AEP over the years. Source: Company Reports The following table shows the dividend payout ratio and dividend coverage for AEP from 2012-2014 (Dividend coverage = Operating Cash Flows/Dividends). 2012 2013 2014 Dividend Payout Ratio 60% 60% 55% Dividend Coverage 4.1x 4.5x 4x Source: Calculations and Companies Reports As the company has been making efforts to improve its operations through increasing regulated energy operations, its cash flows will be positively affected, which will help AEP increase its dividends at a healthy pace in the coming years. Due to its safe and healthy dividends, the stock remains a good investment option for dividend-seeking investors. Conclusion As competitive energy operations remain weak, AEP has been taking the correct strategic decisions to improve its performance. There is a possibility that AEP might choose to sell its competitive energy operations, if the weakness continues to persistent in the segment’s performance despite long-term pricing agreements. The capital expenditures that AEP is making will fuel its rate base and bottom-line growth in the coming years. And the stock’s dividend yield of 3.6%, backed by its cash flows, makes it a good investment option for dividend-seeking investors. Due to the aforementioned factors, I am bullish on AEP.