Tag Archives: send-xhr-start

Start Living An Easier Life And Start Beating The Market Through Contrarian ETF Investments

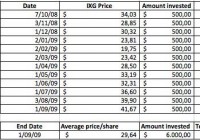
Summary Periodically buying the SPY all the time might be too boring for some people. Mixing things up with this new strategy might be more their cup of tea. As an example, John, our imaginary investor, will be using this new technique during the Financial Crisis of 2009 and during the GREXIT fears of 2012. With this new strategy, John doubled his performance. He gained 40% during 2008 – 2009 instead of 20%, and 22% during 2012 instead of 11%. So why even pick stocks if you can pick ETFs? It’s safer, easier and you’ll be able to beat the market. Discover 3 very interesting opportunities in the market right now, that might also lead to above average results. John might be getting a first position right now. In my previous article , we learned that life could be much easier and that perhaps joining them instead of trying to beat them might be the better option. However, in today’s article, I’ll dig deeper and see if simple investors like John can actually beat the market – by doing just one thing differently. Yes, there’s a way to still beat the market. And today, we’ll back-test that way 2 times + I’ll give you three possible opportunities that might lead to those same market-beating results. The portfolio strategy I’m going to describe to you during this article is all about two words: ‘Contrarian’ and ‘ETFs.’ It’s the Contrarian ETF Strategy. Let’s break down those words. A contrarian: A person who takes a contrary position or attitude; specifically: an investor who buys shares of stock when most others are selling and sells when others are buying. An ETF: A security that tracks an index, a commodity or a basket of assets like an index fund, but trades like a stock on an exchange. So the strategy goes as followed: Instead of picking individual shares of a company that is in trouble – which continues to be the more risky way of being a contrarian – we now decide to periodically buy an ETF related to an industry/commodity or country that is in trouble. You see, each year, there seems to be some sort of crisis going on somewhere in the world. Often does everyone think the world will end (for that particular industry that is in trouble) but in 99% of these cases, the world doesn’t end and these industries find ways to survive. Crises often are opportunities – when played right – and I bet you’re feeling the same thing. Are oil companies offering the opportunity of a lifetime right now? And how about oil suppliers and companies delivering services to oil companies? And what about Russia? Is Russia an opportunity or a value trap? Will the Ukraine – Russia war really last forever? Will oil remain below $100 during the next 10 years? Will Greece leave the EU? Well, I don’t know all the answers, but I do know that I’m very inclined to say “NO” to all of these questions. People love drama. And we all love doom-scenarios. But how often did any of them played out? Also, when you really think about it: Does oil really have to be at $100 before you – as an investor – can make a profit of certain oil related stocks? Hell no. Certain stocks would jump 20% if oil would make a 5% recovery, or would show signs of a simple stabilization. Does Russia really have to report a 2% GDP growth figure before you, as an investor, can make a decent profit? Hell no. Anything positive, anything that gives investors the outlook that “things will get normal again” will make Russian stocks go nuts (hence the 10% bounce in 4 days time that occurred last week). However, while most investors recognize these opportunities and see the possible value in these areas of the market right now, they often see things too pessimistic and are too uncertain. “I don’t know anything about Russian or Greek stocks. I know nothing about oil companies or their suppliers, I don’t know which ones are the good ones.” Well you don’t have to know which ones the good ones are. That’s what ETFs are for. John’s strategy during the financial crisis of 2009. Remember John from my previous article? Well, he’s back in town. John is still buying the SPDR S&P 500 Trust ETF (NYSEARCA: SPY ) each month, and just like he was in my previous article, he still is a pretty smart guy that loves to seize opportunities whenever they come along. Last time, he decided to double his investment efforts during the financial crisis. Instead of buying $500/month during 2009, he decided to buy $1000/month. This time, he’s about to do something even more smart. John figures that the industry that is being hurt most, will also have most upward potential. But instead of picking individual stocks and making risky/uncertain decisions that will make him sleep bad at night, he decides that now is the time to buy a financially related ETF. The iShares Global Financial ETF (NYSEARCA: IXG ) seems to be perfect, as it covers 240 banks. This way, he tries to profit – like a real contrarian – from an industry that is in serious trouble while not exposing himself to too much risk. John puts his monthly investments in the SPY on halt and puts his $500 in the IXG instead. However, like we mentioned, John is a very, very smart guy and he knows that a crash can go on for a long time, and thus that chances are real that he gets in too early. Therefore he has one rule when it comes to his contrarian plays: He will only get a first position after a 40% drop. On October 7, 2008, John finally gets what he wants. The IXG fell 40%. From $58 to $34, and John decides to make a first purchase. He then adds to this position the first of each of the following 11 months. After eleven months, and after investing his 6k, John possesses: 202 shares at an average price of $29.64. Which is far below his original entrance point. Thank god he didn’t went all in at once and stayed with the $500/month rule. (click to enlarge) With this strategy, John scored a ~40% return while not having to time the market, not having to take individual risky picks and while keeping it simple. If he had invested in the S&P 500 through the SPY this whole time, then he had gained 19%. So he doubled his return by making a simple shift in where he puts his assets. Of course, this is just one example where dollar cost averaging on an ETF of a sector in trouble turned out very nicely compared to the regular SPY and this is not a representation of any future scenario. So in order to make this theory a little more valid, let’s take a look at a second example. Same strategy, different scenario During the European Debt Crisis in 2012; everyone thought that Greece would be leaving the Eurozone and that the country would be doomed. On May 16, its main index (the ATHEX), had lost more than 40% compared to its year high in Feb., and was now quoting at 209 points. John didn’t belief that Greece would have to leave the Eurozone (damaging only itself and other members of Europe) and thus he decided to expose himself to the country as a whole. He again stops purchasing the SPY – and decides to buy the Global X FTSE Greece 20 ETF (NYSEARCA: GREK ) with his $500/month. After 11 months of dollar cost averaging, John held 625 shares of GREK at an average price of $14.12 while the index was now above $17. John was able to gain a nice 22% in a relatively safe way, while knowing nothing about Greek stocks. At a certain point, he was sitting on a 40% profit. More interesting though, is that John would have only gained 11% if he had continued to buy the SPY during the same period. So yet again John doubled his return. Conclusion Although periodically investing in the SPY should give one decent returns over time, it seems very likely that whenever a sector/industry/country appears to be in trouble, it might be a wise thing to shift your deposits from the SPY into an ETF related to this industry for the course of a year – after they’ve dropped ~40%. This could lead to market-beating results without much effort and without too much risk. Today, I’m seeing 3 great contrarian plays that fit John’s new strategy: Greece Greece is yet again being confronted with a “Grexit” and the ATHEX dropped more than -44% since January 2014. John would be getting his first position now, and this could lead to above average returns within a year from now. As Aristofanis explains here , a Grexit is very unlikely, just like last time. Russia The Russian index has fallen -48% since January 2014 and is also offering a high risk/reward. A first position of $500 now, could lead to market-beating results within a year from now, if you continue to dollar-cost average on the Market Vectors Russia ETF (NYSEARCA: RSX ) the following months. The fact that you’ll be dollar cost averaging + that you’re buying not a few specific Russian companies, is definitely lowering your overall risk. The Russian – Ukraine conflict can’t go on forever and the sanctions that Europe imposed on Russia could be relieved sooner than expected. Russia is in real trouble, now that the rouble and oil prices dropped so much: It’ll simply have no other choice than to retreat and to improve the situation with the Ukraine in order to save its economy. Oil Oil prices have taken a steep dive and thus it might be more than interesting to consider a position in the SPDR Oil & Gas Exploration & Production ETF (NYSEARCA: XOP ), as it is down more than -45% since its all-time-high of mid last year and holds ~83 holdings. However, further downside is definitely possible as oil hasn’t found its bottom yet. By Q3 of 2015 or early 2016 however, I belief that oil prices will start a sharp recovery. The commonly held belief is that Saudi Arabia is keeping prices so low by not lowering its production to put a stop to the rapid growth of production from the U.S. shale oil plays. Others believe it is their goal to crush the Russian and Iranian economies. If the oil price remains at the current level for a few months longer it will do all of the above and then it has succeeded. Also don’t forget that the low oil price will lead to an increased demand from all major economies who are thrilled to get themselves some cheap oil, if they all do this at the same time, there’s a possible shortage imbound which could lead to much higher prices in a short period of time. Mark Mobius, an economist and regular guest on Bloomberg TV recently said he sees Brent rebounding to $90/bbl by the end of 2015 and I agree with this vision. Although $70/bbl would also be good enough in order to make a profit of this ETF. Main source used for my oil prospects: Here . Read the full article, it is really interesting. Additional disclosure: All figures are coming from Yahoo Finance: I used ADJUSTED figures for dividends and splits for simplicity purposes. Returns are supposed to be accurate though.

How Do You Look At CEF Performance?

Closed-end fund GGN’s share price has felt the hit of weak gold and oil prices. But it pays out big dividends using return of capital. That makes figuring out your return more difficult than you might imagine. Closed-end funds like GAMCO Global Gold, Natural Resources & Income Trust (NYSEMKT: GGN ) and sibling GAMCO Natural Resources, Gold & Income Trust (NYSE: GNT ), two closed-end funds, or CEFs, I have written about recently are odd beasts. They trade like a stock, but are pooled investment vehicles like open-end mutual funds. That not only leads to a disconnect between market price and net asset value, or NAV, but it also makes it harder to decide how you should judge their performance. And, in the end, beauty is in the eye of the beholder on this front. The investment world’s El Camino If you’re as old as I am, or older, you remember the Chevy El Camino. It was an unusual combination of a pickup truck flatbed and a sedan/station wagon front end. Some might call at ugly, some might call it sexy, I would say it’s so weird it’s kind of cool. But, in the end, your individual judgment is what goes for you. Closed-end funds are very similar to El Caminos. That’s not the most flattering complement, but it’s true. They are a “stock-like” front end hitched up to a pooled investment medium. It’s really an ugly stepchild in the investing world, even though CEFs offer some desirable attributes. The big one that catches people’s eye is usually income. A facet of the investment space that CEFs do much better than open-end mutual funds. However, what you get may not be what it appears to be. On the surface you are getting dividends, just like any other stock. But there’s more going on than that and it changes the whole picture. When a stock pays a dividend the money is coming from what it earns (technically it comes out of cash flow). When a closed-end fund pays a distribution (note the different term) it comes out of… the income received from the securities it owns in its portfolio, proceeds from asset sales, and for some funds income from options transactions. ( This article covers some basics on distributions and return of capital, which are beyond the scope of what I’m trying to discuss here.) That’s a big difference. For example, presumably a company that just paid a dividend still has everything in place to earn more money. That’s why stock prices generally don’t fall when a dividend is paid even though the company is, technically, worth less since it just gave its shareholders a chunk of its bank account. The market’s assumption is that it can repeat the process because it’s an ongoing business. A pooled investment vehicle’s value is just the assets it owns, which are all securities. It doesn’t own machinery or patents or stores. When a mutual fund, closed-end or open-end, pays a distribution its value goes down because it just gave away part of what gave it value in the first place. Indeed, net asset value, or NAV, is just the fund’s assets divided by its share count. Give away some of those assets and the NAV has to go down. Performance So when you get a distribution from a closed-end fund how should you think about it? To be fair, it’s a part of your total return. For example, Morningstar’s trailing five-year return for GGN through year-end 2014 is about -5.5% annualized. But a quick look at a graph of GGN’s share price over that time period tells you that it was down nearly 60%. Those two numbers don’t jive. That’s because Morningstar is calculating performance as if the distributions were reinvested. It’s the same way open-end mutual funds are handled. It is, technically, the correct way to look at a closed-end fund’s performance. It’s a pooled investment vehicle, not a stock. But if you are buying a closed-end fund for income, you aren’t likely to be reinvesting those distributions. You are probably living off of them. That means you likely don’t think about performance as a mater of total return (which adds distributions to share price changes). You look at the CEF’s price as the value of what you own and distribution as income you receive, and don’t mix the two. Looked at in that way, GGN is a lousy investment-it’s down 60%! Looked at via total return, reinvesting the distributions, however, it really hasn’t been a bad performer. For example, the Vanguard Precious Metals And Mining Fund (MUTF: VGPMX ) posted an annualized loss of about -11.5% over the trailing five year period though the end of last year. That makes an annualized loss of -5.5% look much better. But that won’t matter to you if your frame of mind is to look at this investment El Camino in a different way. Beauty is in the eye of the beholder I like closed-end funds for the income they offer. They are an easy way to get professional management and income, but they aren’t perfect and they aren’t right for everyone. If you want a long-term investment that appreciates in value and pays you a large dividend, you are probably better off investing directly in stocks. Not too many closed-end funds pull that combination off. If you can get your head around total return as your benchmark, then CEFs can work for you as long-term holdings. That said, there are other ways to look at investing in CEFs. For example, trying to capture a shrinking discount when that discount gets unusually wide for some reason. That, in the end, is the play I’ve highlighted with both GGN and GNT. However, even this doesn’t change the need to get a handle on how you want to look at CEF performance and what that means for your investment approach.

Investing In Africa: A Long-Term Growth Opportunity?

Summary Certain indicators point to an overvalued S&P 500. Prudent investors should consider more attractively valued indexes. Despite headwinds, Africa’s improving fundamentals suggest long term growth opportunities. As the new year begins to take shape, most investors have their attention squarely focused on the United States as the oasis of growth in a desert of underperforming national economies. Nevertheless, when we take a closer look at the key American stock market index, the S&P 500 (NYSEARCA: SPY ), it would appear that many market observers consider it to be overvalued. Some suggest that its blended P/E ratio of 17 is on the upper end of its historical normal valuation range since 2001, others warn that it is historically expensive relative to GDP and finally most point to the Shiller P/E which currently sits at 26.4, which is 59% higher than the historical mean of 16.6. Although it is difficult to make accurate broad valuation forecasts for a large collection of companies such as the S&P 500, such forecasts can be useful to the prudent investor. If we are willing to accept that many companies trading on the S&P 500 are trading at or above their fair value we may at minimum need to consider the possibility of a slowdown in broad index growth over the coming year. As such, the prudent investor may want to start contemplating other more attractively valued indexes. It would appear that such opportunities lie in Africa. Despite several headwinds such as the effects of the Ebola virus, civil unrest (Boko Harem), the slowdown in the global economy and the drop in the price of oil, Africa remains a resilient continent poised to record around +5% economic growth. In a recent report Yogesh Gokool, head of the AfrAsia Bank explains that this growth will be primarily driven by more foreign direct investments and remittances from non-OECD (Organization for Economic Co-operation and Development) countries that will continue to pour money into corporate acquisitions and large-scale infrastructure projects. Resource rich countries will continue to attract the lion share of FDIs into Africa yet with the drop in the price of oil and rising wages in Asia, manufacturing will also be a significant recipient. The other main driver of growth will be private consumption. In a recent report by the United Nations Economic Commission for Africa entitled African Economic Outlook 2015 it was found that private consumption in Africa is expected to accelerate by 0.5 percentage points to 3.8 percent in 2015 due to consumer confidence and the expanding middle class. Private Consumption and gross capital formation are expected to be key drivers of growth (click to enlarge) Data Source: UN-DESA, 2014 In addition, inflation should remain under control by 0.4 percentage points to 0.7 in 2015. Subdued inflation across economic groupings (click to enlarge) Data Source: UN-DESA, 2014 As for fiscal deficits, the current account balance is expected to decline but remain positive for oil exporting countries while the current account deficit may rise less than expected due to lower oil prices for oil importing countries. Moderating fiscal deficits expected in 2015 among country groupings (click to enlarge) Data Source: EIU, 2014 As mentioned above, certain downside risks could slow economic growth in Africa such as the effects of the Ebola virus, civil unrest (Boko Harem), the drop in oil and commodity prices and a global growth slowdown. Based on early assessments , the economies of Guinea, Liberia, Sierra Leone are experiencing significant hardship as public finances are strained and household incomes are dropping. Nevertheless, the economic impact is not as bad as some feared as the World Bank estimated that Ebola could cost the region as much as $32 billion and the real cost appears to only be a tenth of that figure. In fact, a positive impact of the outbreak seems to be the renewed urgency to reinforce basic public health systems in vulnerable regions. As for lower commodity prices, the negative impact on the continent’s growth may be offset as lower prices will help ease balance of payments pressures in food and energy importing countries while commodity exporting countries face lower export earnings. Furthermore, these commodity declines will serve to reaffirm the benefits of more diversified national economies. Finally, in the face of a potential global slowdown Africa should remain attractive as its economic fundamentals remain sound . Governance and macroeconomic management have improved. Investment in infrastructure, human and physical capital are increasing. Productivity, the middle class and diversified trade are all growing and finally a culture of entrepreneurship is being created. Conclusions Given the risks outlined above and my belief that stable growth in Africa is still a long way off, it may be better to describe investing in Africa as an opportunity for the enterprising investor rather than the prudent investor. Nevertheless, if you remain patient and take a long-term view of an investment in Africa, you may be interested in several ETFs which have African exposure and are currently trading near their 52 week lows. The first is the Market Vectors Africa Index ETF (NYSEARCA: AFK ), which allocates just over a quarter of its weight to developed market countries that do business in Africa. This allocation serves to reduce some of the fund’s exposure to the volatility of local African markets. The fund is heavily weighted to South Africa, Egypt and Nigeria with financials accounting for around 40% of the fund while materials and energy account for around 30%. The other ETF of note is the Guggenheim Frontier Markets ETF (NYSEARCA: FRN ). This fund invests in a collection of small, illiquid and risky markets with great growth potential known as frontier markets . These often high yielding markets have become an asset class in their own right and the fund’s exposure to Africa is only about 13%, with the rest allocated to other markets in Latin America.