Bad News Is Good News: A Contrarian View Of China Investing
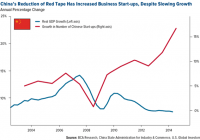
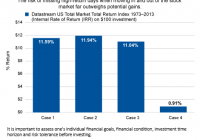
A Healthy Balance Between Monetary and Fiscal Support. Government to Remain Accomodative. Oil Sinks, Airlines Take Flight. When China celebrates its new year next month, we will transition into the Year of the Ram, also known as the Year of the Goat or Sheep. If you believe in luck, this could be a good sign. The ram comes eighth in the 12-zodiac cycle, and in Mandarin, “eight” sounds very similar to the words meaning “prosper,” “wealth” or, in some dialects, “fortune.” As you might imagine, the Chinese consider the number to be very lucky. But of course successful investing involves so much more than luck. In a time when not only China but much of the rest of the world is trying to get its groove back, it’s important to be cognizant of the factors that shape the markets, including changing government policy. We often say that government policy is a precursor to change, so it’s important to follow the money. With that in mind, I asked portfolio manager Xian Liang to outline a few of the most compelling cases to remain bullish on the Asian giant. Below are some highlights from our discussion. A Healthy Balance Between Monetary and Fiscal Support Back in October, I pointed out that one of the main contributors to the European Union’s sluggish growth is its inability to balance its monetary and fiscal policies. It has been eager to tax everything and everyone who moves. Waiting for European Central Bank (ECB) President Mario Draghi to act often feels a little like waiting for Godot. Investors’ patience is wearing thin. China, on the other hand, is much more responsive and actively committed to making full use of both policies in its arsenal to spur its cooling economy. On the monetary side, according to Xian, are interest rate cuts and a loosening of reserve requirements for certain deposits. The goal is to ease access to loans for businesses and individuals seeking to purchase big-ticket items such as homes. As a result, Chinese entrepreneurs have increasingly been able to start more businesses. (click to enlarge) Jobs growth has been so robust, in fact, that the government has managed to attain its job creation target outlined in its current Five-Year period ahead of schedule and by a wide margin. The country has grown millions of jobs with great efficiency, even as GDP sags. Although the Chinese housing market has stagnated in recent months, these new monetary measures will help it pick up steam. Already we’re seeing some improvement, with home property stocks moving higher. Regulations are an indirect taxation of the economy, whereas deregulation unleashes entrepreneurial spirit. (click to enlarge) On the fiscal front, the government is reportedly planning to spend $1.6 trillion over the next two years on infrastructure projects in various industries-300 separate infrastructure programs, to be exact, according to BCA Research. As I pointed out last month, many of these projects will largely involve high-speed rail, both domestically and abroad. China has already secured multiple construction deals with countries ranging from Brazil, South Africa, Nigeria, India, Russia, the U.S. and others. Government to Remain Accommodative There are a couple of reasons the Chinese government has accelerated support to capital markets, according to Xian: One, a significant deflationary threat has been driven by slumping energy prices. And two, there are potentially lower exports to commodity producing nations. Indeed, sluggish global demand has contributed to China’s weak December purchasing manager’s index (PMI), which dropped to an 18-month low of 50.1. China has been quick to respond to lower PMI data with a drop in interest rates. (click to enlarge) But Where There’s Bad News, Good News Is Often Not Far Behind The silver lining to falling commodity prices is that since China is a net-importer of raw materials-crude oil especially-the country has been able to save tremendously on its oil and gas bills. Back in November, I reported that for every dollar the price of a barrel of oil drops, China’s economy saves about $2 billion annually. From its peak in June, crude has slipped close to $50-you do the math. This has served as a major wealth transfer from oil-producing countries into China’s coffers. Oil Sinks, Airlines Take Flight Speaking of crude, declining oil prices-they’re currently below $50 per barrel-have been good for airlines, Chinese companies included. As you can see, there’s been a clear inverse relationship between crude oil returns and airline stocks. (click to enlarge) China is the largest investor in U.S. government bonds. The country has accumulated close to $1.3 trillion, so a strong dollar and falling oil prices benefit its economic flexibility. More middle-class Chinese might be able to afford to travel abroad, specifically here to the U.S., where inevitably they will spend their money. (click to enlarge) According to Carl Weinberg, founder and chief economist of High Frequency Economics: Chinese President Xi Jinping has estimated that there will be more than a half-billion Chinese tourists traveling to the West in the next 10 years. You can work out the impact if all of them came to New York and spent $2,000 or $3,000 each. That would be enough to add a half-percentage point to U.S. GDP every year over the next decade. Reasonable Stock Valuation Chinese stocks are currently valued below their own historical averages as well as those among other global emerging markets, making them both attractive and competitive. “Odds favor mean reversion to continue,” Xian says. “The better the Chinese markets perform, the more global liquidity they might attract.” Chinese stocks, as expressed in the MSCI China Index, are currently a much better value than those in the S&P 500 Index, trading at 10 times earnings whereas the U.S. is trading at 18 times. (click to enlarge) A-Shares Still a Huge Draw Chinese A-Shares surprised the market by breaking out last summer, having delivered 66 percent for the 12-month period. It looks like a breakout from the long-term bear market. (click to enlarge) What’s more, the upside is unlikely to have been exhausted. Although they aren’t as stellar of a bargain as they once were, they’re not yet overvalued, and retail and institutional investors might accumulate on pullbacks. For the A-Shares market, we have recently added exposure to A-Shares in one of our funds to capture more attractive valuation. In today’s environment, we believe the safer bets are investable H-Shares, which are driven by A-Shares and, in 2014, returned 15.5 percent. H-Shares comprise the vast majority of the fund’s exposure to Chinese equities, with further exposure gained through A-Shares exchange-traded funds (ETFs). The Ram Is the New Bull As GARP (growth at a reasonable price) hunters, we’re prudently optimistic about the upcoming year and anticipate great things out of the world’s second-largest economy. China’s government and central bank are committed to jobs and manufacturing growth as well as policy easing. Its stocks are reasonably valued, and low commodity prices should continue to offset slowing global demand. As Xian eloquently put it last month: China’s leadership appears to be delivering on the promises it made in November 2013 at the Third Plenary Session, specifically the liberalization of the financial sector and reform of the role capital markets play in allocating resources. This leadership is determined and committed to putting China on the right path. Past performance does not guarantee future results. Foreign and emerging market investing involves special risks such as currency fluctuation and less public disclosure, as well as economic and political risk. By investing in a specific geographic region, a regional fund’s returns and share price may be more volatile than those of a less concentrated portfolio. The HSBC China Services PMI is based on data compiled from monthly replies to questionnaires sent to purchasing executives at more than 400 private service-sector companies. The MSCI China Free Index is a capitalization weighted index that monitors the performance of stocks from the country of China. The S&P 500 Stock Index is a widely recognized capitalization-weighted index of 500 common stock prices in U.S. companies. Standard deviation is a measure of the dispersion of a set of data from its mean. The more spread apart the data, the higher the deviation. Standard deviation is also known as historical volatility. Fund portfolios are actively managed, and holdings may change daily. Holdings are reported as of the most recent quarter-end. Holdings in the China Region Fund as a percentage of net assets as of 9/30/2014: Air China Ltd. 0.00%, China Eastern Airlines 0.00%, China Southern Airlines Co. 0.00%. All opinions expressed and data provided are subject to change without notice. Some of these opinions may not be appropriate to every investor. By clicking the link(s) above, you will be directed to a third-party website(s). U.S. Global Investors does not endorse all information supplied by this/these website(s) and is not responsible for its/their content.