Tag Archives: send-xhr-start

The Consequences Of Overvaluation: A Word Of Caution To Funeral Owners And Fund Managers

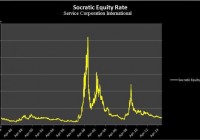
The Socratic Equity Rate is one tool investors can use to identify areas of value and over-value. Compared to past levels, a high yield might indicate areas of value. Compared to past rates, a low rate indicates investors might want to be cautious. If you ever owned a diversified mutual fund or ETF, chances are, at one time you were a part owner of a funeral services business. For those running the fund, and especially for owners of shares in a funeral services business such as Service Corporation International (NYSE: SCI ), it is essential to be familiar with the Socratic Equity Rate . Developed by The Socratic Investor, the Socratic Equity Rate was designed to assist in identifying opportunity and risk in investment securities. Intended for board of directors, company management, securities lawyers, fund managers and individual investors, this proprietary equity rate is a number to understand. The Trial of Socrates | The Death of Socrates movie trailer, by educationalmovies For an investment fund manager, the higher the current Socratic Equity Rate is compared to past readings, the more attractive an investment might be. The lower the reading, the more cautious an investor should be. For another professional, the readings will be the same but the takeaway will be different. The key is to know the historical range, be able to identify anomalies, and know what to do when those areas of value or overvalue appear again. Although the last part will be different depending on what role you play in the investment world, the concept is the same . Examine the performance of Service Corporation International after SCI’s Socratic Equity Rate reached 25% in 2000. From $1.75 to $13.81, SCI’s return was one of the best in the market. At a Socratic Equity Rate near the highest recordings ever seen in SCI’s history, Service Corporation International was a buy. For a board member, a lower number might indicate a time to incentivize management to issue equity . If private companies are cheap, management would be smart to pay using overvalued equity. A deal that won’t rest in peace, by TheDealVideo Take a look at the performance of investing in SCI when the Socratic Equity Rate was near its lowest levels ever. From $10.00 to $5.08, SCI investors experienced devastating returns. At a Socratic Equity Rate near the lowest readings ever, 1%, SCI’s overvalued equity presented management an opportunity to acquire another funeral company’s crown jewels without spending cash . On the other hand, if you are a private funeral home business owner looking to sell, and the acquiring company wants to pay in stock, you better know how overvalued the stock they want to pay with is. Knowing the Socratic Equity Rate can help protect your crown jewels from theft, as what happened to Time Warner when AOL paid using tech-bubble inflated AOL shares to merge. Ted Turner’s biggest regret, by CNNMoney From a securities law standpoint, an upstanding securities lawyer might consider using this rate as a tool to defend the innocent teacher’s pension fund or university endowment fund that lost money. By exhibiting a Socratic Equity Rate near the lowest levels ever, the lawyer could argue the fund manager breached their fiduciary duty by paying a premium substantially above historical norms. Examine what could happen to a fire-fighter pension’s investment when a supposed fiduciary buys SCI at a Socratic Equity Rate of 1%, a reading that is one of the lowest on record. If the supposed,”fiduciary” keeps ignoring the Socratic Equity Rate, one day there may not be a pension for retired fire-fighters. At a level near 2.1% today, SCI’s Socratic Equity Rate is approaching the lower end of its historical readings. Fund managers and individual investors should remain defensive. Be advised, this is not investment advice. The Socratic Equity Rate is one tool out of an entire tool box of equity valuation methods. Your decision to buy, sell or sue will depend on your profession and further research is always recommended. Thanks be to YCharts, who provides The Socratic Investor with Service Corporation International financial data.

NRG Energy: Kicking Its Residential Solar Segment Into High Gear

Summary Over the past few days, NRG Energy has further outlined its goals of residential solar domination. The company plans to be the second largest residential solar company by the end of 2015, which is a huge task considering its current 5th place position. NRG Energy’s management is surprisingly forward-thinking in its embrace of distributed residential solar, an industry inherently at odds with centralized fossil fuel generation. Residential solar has been growing at an astounding 40%-50% CAGR over the past few years, outpacing the growth of the broader solar industry. As the inherent advantages of distributed solar have become more clear, the switch from centralized energy to distributed generation has been a no brainer for many individuals. UBS AG (NYSE: OUBS ) has even stated , “By 2025, everybody will be able to produce and store power. And it will be green and cost competitive, i.e., not more expensive or even cheaper than buying power from utilities. It is also the most efficient way to produce power where it is consumed, because transmission losses will be minimized. Power will no longer be something that is consumed in a ‘dumb’ way. Homes and grids will be smart, aligning the demand profile with supply from (volatile) renewables.” While the vast majority of utilities have been bitterly opposing residential solar companies, NRG Energy (NYSE: NRG ) is looking to join them. NRG Energy, which is one of the largest fossil fuel utilities in the U.S., is surprisingly optimistic about home solar. While this viewpoint may seem contradictory given the opposing natures of centralized fossil fuel generation and distributed residential solar, NRG Energy certainly does not view it this way. NRG Energy has made its residential solar intentions much clearer in recent days. The company has announced that is planning to become the 2nd largest residential solar company, right after SolarCity (NASDAQ: SCTY ), by the end of 2015. This goal is indicative of NRG Energy’s incredibly ambitious distributed energy plans, as it has to increase its residential solar business by a number of magnitudes to accomplish this goal. While NRG Energy is currently ranked at a respectable 5th place in residential installs as of quarter 3, the gap between itself and 2nd place Vivint Solar (NYSE: VSLR ) is huge. NRG Energy still has a market share in the low single digit percentages as opposed to Vivint Solar’s approximately 15% market share. In fact, SolarCity and Vivint Solar make up for more than half of the residential solar industry’s market share. As a result, NRG Energy has started putting in enormous efforts to build and scale up its residential solar business in order to compete with the industry standouts. NRG Energy’s Unique Competitive Edge NRG Energy’s current position as one of the nations largest utilities gives it a financial clout and leverage never seen before in the emerging residential solar market. While all the top residential solar companies could have easily been classified as startups just a few years back, with SolarCity as no exception, NRG Energy is entering the industry as a proven and established business with countless billions on its balance sheet. The company’s huge finances and reputation as a proven business will give it an undeniable advantage over its competitors in the form of lower capital costs. Financiers could very well give NRG Energy cheaper access to capital due to the company’s already established brand. Of course, while most of NRG Energy’s cash will be tied its main business of centralized fossil fuel generation, having its huge fossil fuel business backing up its burgeoning residential venture will be invaluable for the company. NRG Energy could easily leverage its financial clout and well-established brand name to help achieve its grand solar ambitions. Forward-Thinking Management While it is extremely surprising to see a fossil fuels based utility focus so much attention on the distributed generation, this hints at NRG Energy’s extremely forward-thinking nature. Despite the fact that residential solar poses an existential threat to the company’s predominantly centralized generation model, NRG Energy’s management hold no bias against residential solar, and is in fact embracing this growing trend. The company’s enthusiasm about distributed residential solar starts at its CEO David Crane. He is so optimistic about residential solar that he has been qouted as saying, “We expect to convincingly persuade our investors that NRG has an embedded SolarCity within it,” and that “everyone is beginning to believe that residential solar is this trillion-dollar market that currently has about 1 percent market penetration.” David Crane is clearly all-aboard residential solar. Having a utility state that residential solar has the potential to be a trillion-dollar market is shocking to say the least, and would have been utterly unbelievable just a few years ago. His optimism is also a clear sign of residential solar’s promise. In fact, Crane sees so much potential in the company’s distributed residential solar segment that he is even considering creating a separate residential solar spin-off. Although a negligible percentage of NRG Energy’s revenue comes from residential solar, the company has been heavily emphasizing this aspect of their business in recent weeks. Just a few days ago, for instance, the company issued a press release and presentation touting residential solar’s immense potential, and the company’s plans for heavy future involvement in this industry. While residential solar currently makes up for less an 1% of the United States total energy generation, the company clearly believes in its exponential growth capabilities. NRG Energy’s recently released presentation constantly reminds investors of the emerging distributed generation. This specific graphical illustration from the presentation depicts the continually diminishing role of centralized generation as opposed to the growing role of distributed generation. (click to enlarge) Source: NRG Energy Risks Despite the immense promise of distributed residential solar, there is a considerable risk that the industry may not grow or mature as fast of NRG Energy has planned. In this case, the company’s would be in danger of losing sizable amounts of money on its massive residential solar infrastructure investments. The company is still, after all, making a huge bet on a relatively young industry with an abundant amount of uncertainty. Many factors pushing residential solar’s growth, such as subsidies or net metering policies, are largely out of the company’s control. Regardless of the risks, NRG Energy is likely making a wise decision by focusing on the residential sector, as most indicators point to distributed generation as the energy model of the future. The only obstacle truly holding distributed residential solar back from mass adoption is the lack of cost-effective storage devices. Even this though, will likely change in the future as battery innovations have sped up dramatically with the recent electric vehicle boon. Conclusion NRG Energy is changing with the times and embracing the shifting energy landscape. With solar power experiencing an exponential growth curve, the company is well-aware of residential solar’s future potential. NRG Energy’s valuation of $9B does not factor in the growth potential of distributed generation, and the company’s involvement in this highly promising arena. If distributed solar generation ends up replacing centralized generation as much of the evidence has suggested , NRG Energy will have a huge amount of upside given its early investment in the arena. While Vivint Solar is rapidly gaining on SolarCity in terms of marketshare, NRG Energy will likely be SolarCity’s true competition moving forward.

Industrial Metals ETFs Investing 101

A stronger greenback, falling oil prices and an economic slowdown in China have lately emerged as major headwinds for the global metal industry. Moreover, excess supply has been a perennial problem for the industry. Iron ore has lost 50% of its value in 2014, the biggest annual decline in at least five years, impacted by excessive inventory along with abundant supply and slow economic growth in China. Global steel production has also been weak, mainly dragged down by a slowdown in China’s output, which affected demand for iron ore, its main ingredient. The low prices have squeezed margins of iron producers leading to the cancellation or suspension of mining projects. Moreover, softness in China amid an oversupply had led to a decline in copper prices in 2014. Copper prices further dipped to a four-year low in November end to $2.861 per pound on falling oil prices. Overall, copper fared the worst among all industrial metals, with prices declining 11% through the year. On the other hand, during 2014, the global aluminum industry went through a substantial change to correct the supply-demand imbalance. Major aluminum producers like Rusal and Alcoa Inc. (NYSE: AA ) cut their aluminum production, resulting in tightening of aluminum supply, which sent the metal’s prices northward. However, in the last months of 2014, falling oil prices and weak industrial data from China have led to a drop in aluminum prices. Aluminum is an energy intensive industry, with energy costs accounting for nearly 30% of the total cost of production. Falling oil prices tend to have a deflationary effect on aluminum. Nevertheless, aluminum prices ended the year with a 13% gain, higher than January levels. What’s in Store? Iron : The threat of oversupply looms large over the iron ore industry as major producers, Rio Tinto, BHP Billiton Ltd. (NYSE: BHP ), Vale S.A. (NYSE: VALE ) and Fortescue Metals Group Ltd. ( OTCQX:FSUGY ), continue to ramp up production. Australia, the world’s top exporter, cut its iron ore price estimate for next year by 33% as the surging output will outpace Chinese demand growth, leading to a supply glut. Global apparent steel use is expected to grow 2% in 2015 to reach 1,594 Mt. Softness in steel demand in China will continue to be a drag on the same. China is the largest consumer of iron ore, accounting for around 60% of the global seaborne market. Thus, the mismatch between the excess supply and demand for iron ore will keep iron ore prices subdued in the near term. Aluminum : Aluminum consumption is expected to improve on a global basis spurred by the automotive and packaging industries, its key consumer markets. The airline industry is also expected to boost demand for the metal. Following China, which accounts for over 40% of the global aluminum consumption, India appears promising given its current low level of aluminum consumption and high urban population growth. With demand remaining strong and the industry pulling in the reins on supply, the aluminum market is likely to witness deficits for a prolonged period. This will support high aluminum prices going forward. Copper : The copper market seems to be shifting into supply surplus. In the near term, prices will be influenced by economic activity in the U.S. and other industrialized countries. Revival in demand from China will also act as a catalyst. Notwithstanding the current volatility in prices, we have a long-term bullish stance on copper, supported by its widespread use in transportation, manufacturing and construction, limited supplies from existing mines and the absence of new significant development projects. To Sum Up A revival in the Chinese economy on the back of policy support and correction of the supply-demand imbalance will be instrumental in driving growth in the industry, while projected earnings growth for 2015 instills optimism in the same. ETFs to Tap the Sector An ETF approach can help spread out assets among a variety of companies and reduce company-specific risk at a very low cost. There are currently two ETFs available to play this sector. SPDR S&P Metals & Mining ETF (NYSEARCA: XME ) Launched in Jun 2006, XME seeks to replicate the S&P Metals and Mining Select Industry Index. The S&P Metals & Mining Select Industry Index represents the metals and mining sub-industry portion of the S&P Total Market Index. The fund currently has AUM of $390.4 million. XME has a trading volume of roughly 1.6 million shares a day, suggesting little or no extra cost in the form of bid/ask spreads. The ETF is a low-cost choice, charging a net expense ratio of 35 basis points a year, while the dividend yield is 2.30% currently. The fund currently holds 35 stocks in its basket, with only 38.12% of assets in the top 10 holdings. From a commodities perspective, the product is heavily weighted toward steel with 41% sector weightage, followed by coal and consumable fuels (17%), diversified metal and mining (13%), aluminum (11%), silver (7%), gold (7%) and precious metals and minerals (4%). Among individual holdings, top stocks in the ETF include Hecla Mining Co. (NYSE: HL ), TimkenSteel Corporation (NYSE: TMST ) and Compass Minerals International Inc. (NYSE: CMP ) with asset allocation of 4.19%, 4.14% and 3.88%, respectively. iShares MSCI Global Metals & Mining Producers ETF (NYSEARCA: PICK ) The ETF seeks to match the price and yield performance of MSCI ACWI Select Metals & Mining Producers Ex Gold & Silver Investable Market Index. This index measures the equity performance of companies in both developed and emerging markets that are primarily involved in the extraction and production of diversified metals, aluminum, steel and precious metals and minerals, excluding gold and silver. Launched in Jan 2012, the fund has so far attracted AUM of $158 million. It has a trading volume of roughly 16,257 shares a day. The ETF is currently charging a net expense ratio of 39 basis points a year, with a dividend yield of 2.91%. The fund currently holds 209 stocks with 98% sector weightage toward basic materials. The fund allocates nearly 50% of the assets in the top 10 firms, which suggests that company-specific risk is somewhat high, as the top 10 holdings dominate half of the returns. Among individual holdings, top three stocks in the ETF include BHP Billiton Limited ( BHP ), Rio Tinto plc (NYSE: RIO ) and Glencore Plc (GLEN.L) with asset allocation of 10.81%, 8.4% and 6.76%, respectively. The fund is widely diversified across various countries, and Australia tops the list, holding 24.7% of the fund, followed by the United States (10.9%) and United Kingdom (9.96%). These three nations make up for nearly 46% of the assets.