Tag Archives: send-xhr-start

How Does VXX’s Daily Roll Work?

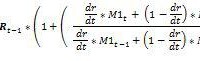
All volatility Exchange Traded Products (ETPs) use indexes that track a mix of two or more months of the CBOE’s VIX Futures. Calculating this mix is not trivial and has resulted in a lot of bleary eyes – including my own. My intent with this post is to help you understand, and if you desire, accurately compute the key indexes used in the iPath S&P 500 VIX Short-Term Futures ETN (NYSEARCA: VXX ) and other short-term volatility funds using Excel or similar tools. Why do we need a roll anyway? If we could directly buy the CBOE’s VIX index none of this would be necessary. Unfortunately, no one has figured out a cost effective approach so we are forced to use the next best thing – VIX Futures. Like options, VIX futures have fixed expiration dates so volatility indexes need a process of rotating their inventory of futures in order to have consistent exposure to volatility. This rotation process is evident in the open interest chart below – the next to expire futures being closed out and the next month of futures being opened. Indexes and Funds are different things Before we dive into the details of how this rotation is dealt with, I’d like to address one source of confusion. ETPs are not obligated to follow the approach detailed in the indexes. They are allowed to use other approaches (e.g., over-the-counter swaps) in their efforts to track their indexes. When ETPs are working properly, their prices closely track the index they specify in their prospectus minus their fees that are deducted on a daily basis. Because indexes are theoretical constructs they can ignore some practical realities. For example, they implicitly assume fractional VIX futures contracts exist and that the next day’s position can be put in place at market close – even though calculating that position requires market close information. I’m sure these issues cause headaches for the fund managers, but to their credit the funds usually closely track their index. The Index Calculation The details for the index (ticker SPVXSTR ) that VXX tracks are detailed in VXX’s prospectus , pages PS-21 through PS-22. The math is general enough that it covers both the short term index that VXX uses and the midterm index VXZ uses – which adds to its complexity. The equations use Sigma (?) notation, which probably makes it challenging for people that haven’t studied college level mathematics. I will present the math below using high school level algebra. Except for interest calculations all references to days are trading days, excluding market holidays and weekends. The volatility indexes used by short-term volatility ETPs ( list of all USA volatility ETPs ) utilize the same roll algorithm – at the end of each trading day they systematically reduce the portion of the overall portfolio allocated to the nearest to expiration contracts (which I call M1) and increase the number of the next month’s contracts (M2). The mix percentages are set by the number of trading days remaining on the M1 contract and the total number of days it’s the next to expire contract (varies between 16 and 25 days). So if there are 10 days before expiration of the M1 contract out of a total of 21 the mix ratio for M1 will be 10/21 and 11/21 for M2. At close on the Tuesday before the Wednesday morning M1 expiration there’s no mix because 100% of the portfolio is invested in M2 contracts. It’s important to understand that the mix is managed as a portfolio dollar value, not by the number of futures contracts. For example, assume the value at market close of a VIX futures portfolio was $2,020,000, and it was composed of 75 M1 contracts valued at 12 and 80 M2 contracts at 14 (VIX futures contracts have a notional value of $1K times the trading value). To shift that portfolio to a 9/21 mix for M1 and 12/21 for M2 you should take the entire value of the portfolio and multiply it by 9/21 to get the new dollar allocation for M1, $865,714 (72.14 contracts) and 12/21 times the entire portfolio value to get the dollar allocation for M2, $1,154,286 (82.45 contracts). Value weighting gives the index a consistent volatility horizon (e.g., 30 calendar days) – otherwise higher valued futures would be disproportionately weighted. The next section is for people that want to compute the index themselves. Yes, there are people that do that. If you are interested in the supposed “buy high, sell low” theory of roll loss you should check out the “Contango Losses” topic at the bottom of this post. The Variables Lower case “t” stands for the current trading day, “t-1” stands for the previous trading day. The index level for today (IndexTR t ) is equal to yesterday’s index (IndexTR t-1 ) multiplied by a one plus a complex ratio plus the Treasury Bill Return TBR t. The index creators arbitrarily set the starting value of the index to be 100,000 on December 20th, 2005. The number of trading days remaining on the M1 contract is designated by “dr” and the total number of trading days on the M1 contract is “dt.” M1 and M2 are the daily mark-to market settlement values, not the close values of the VIX futures. The CBOE provides historical data on VIX futures back to 2004 here . The Equations When dr is not equal to dt: When dr = dt (the day the previous M1 expires): Yes, this equation could be simplified, but then it wouldn’t fit as nicely into the equation below which uses a little logic to combine both cases: The equation assumes that the entire index value is invested in treasury bills. Contango Losses An interesting special case occurs when you assume that the M1 and M2 prices are completely stable and in a contango term structure for multiple days-for example, M1 at 17 and M2 at 18. In that situation the equation simplifies to: This special case illustrates that there is no erosion of the index value just because it’s selling lower price futures and buying higher priced futures-in fact it goes up because of T-bill interest. It’s the equivalent of exchanging two nickels for a dime-no money is lost. For more on this see: The Cost of Contango-It’s Not the Daily Roll . Disclosure: None

The Permanent Portfolio Fund Looks Weak Long-Term

Summary Harry Browne’s simple concept of the permanent portfolio is still valid and is a low volatility method of passive investing. PRPFX does not closely follow the original concept of the PP and the current allocation is closer to stock picking than passive investing. PRPFX has become too volatile to be considered as a safe, long-term investment. Constructing your own PP with ETFs is cheaper than the mutual fund fees and allows you to stick with the original concept. While the concept is still valid today, it needs to be modernized in terms of internationalizing the asset classes and not putting all of the PP into one country. The Permanent Portfolio Concept In the early 80s, the idea of the permanent portfolio was created by Harry Browne and Terry Coxon and was laid out in a series of books written by the two. The whole concept is based upon the idea that nobody knows exactly what will happen in the future, and your investments should reflect this fact. The permanent portfolio calls for splitting the assets equally into 4 parts: 25% stocks, 25% bonds, 25% cash, and 25% gold. The portfolio would be rebalanced once a year, or if any one asset rises too much during the year. The purpose of this allocation is to have at least one portion of your portfolio doing well, regardless of the economic environment at the time. Harry Browne referred to 4 different general economic scenarios that the portfolio would address: inflation, deflation, prosperity, and depression/recession. The world around us is not quite that simple however, and today we see a hodgepodge of these 4 scenarios. There is deflation in things like oil, gold, silver, and smartphone technology, at the same time as inflation in medical care, college tuition, and certain food items. You cannot label today’s economy with only one term such as inflationary or deflationary. As Jim Rickards says , inflation and deflation are now locked into a very equally matched game of tug-of-war, since high amounts of force and tension on both sides will result in the rope being tugged nowhere despite all of the forces at play. Because of this, the permanent portfolio concept is even more relevant today than in the past. The 25% allocation to gold is enough to give most financial advisors the shivers, but when you look at the results of the PP compared to each of its components individually, it makes a lot more sense. (click to enlarge) Basically you end up with conservative gains and a lot less volatility overall. I would compare the PP strategy to riding a bicycle with training wheels on a flat path while wearing a helmet, elbow pads, and knee pads. You could certainly still crash, but you won’t be as scraped and banged-up as if you had gone all in with the stock market, for example, and it won’t be too terribly difficult to pick yourself up and be headed back down the path. So with this in mind, let’s look at the mutual fund that was based on Browne’s concepts and the flaws that it currently has. Permanent Portfolio Fund – PRPFX This is the flagship fund from the Permanent Portfolio Family of Funds. The fund was founded in 1982 by Terry Coxon and John Chandler. The allocation is quite a bit different than the original PP concept. It is only loosely based around the 25% x 4 allocation, as it has 6 asset classes made up of 36% US dollar assets, 20% gold, 15% aggressive growth stocks, 15% real estate and natural resource stocks, and 10% Swiss franc assets and 5% silver. The biggest problem with this allocation is the great over-emphasis on commodities. The purpose of having 1/4 gold in the PP concept is to act as something that will go up in periods of severe inflation and/or economic turmoil. Adding natural resource stocks and physical silver just adds more volatility that isn’t even necessary. Extra volatility is exactly what you don’t want for a long-term, wealth compounding fund. Take a look at the level of volatility since 2011. (click to enlarge) Does this look like a steady, conservative fund that you can dollar-cost average into every month and compound your wealth with? No investor should accept this level of volatility on something that is supposed to be safe and conservative. But let’s not get too caught up in the short-term price, let’s look at how PRPFX did since 2000 compared to the Dow and the S&P 500. (click to enlarge) As you can see, PRPFX beat the two indexes over the long run, so if you bought this fund in the year 2000 then you deserve a pat on the back. However, if you are looking to start a position or continue an existing position in this fund, you are in for a bumpy ride. Instead of safely biking down a straight path with training wheels and pads on, you will be wearing no safety equipment and speeding further across a very hilly/curvy terrain. The distinction always needs to be made between investing and speculating when it comes any particular security, and in the case of PRPFX the inherent problem with the allocation is that commodities and particularly natural resource stocks are speculative in nature. So mixing these things in with bonds and bank deposits creates a problem. Take some of the mining stocks the fund holds for example, BHP , Vale S.A. (NYSE: VALE ) and Peabody Energy (NYSE: BTU ). BHP is the biggest mining company in the world, but even this fact does not stop it from being volatile and thus speculative in nature. It does not belong in a portfolio of money that you can’t afford to lose. In the cases of Vale S.A. and Peabody, the first company went down 40% over the year 2014 and the second went down 62%. (click to enlarge) Again, these are not the kind of companies you want to have in a portfolio that you expect to draw from in retirement or further down the road. The heavy weighting towards commodities does the fund well when the commodities themselves are in the midst of a bull market, but when the commodities are in a long period of decline it’s very detrimental to the long term investing approach. If you want to implement the original concept, you can do so using ETFs that will result in lower expense ratios compared to the expense ratio of .75% for PRPFX. Below is an example of a cheaper method of using the original 4 x 4 concept with ETFs: 25% Vanguard S&P 500 ETF- VOO -Expense ratio .05% 25% Vanguard Long-Term Bonds ETF- BLV -Expense ratio .10% 25% Vanguard Short-Term Bonds ETF- BSV -Expense ratio .10% 25% iShares Gold Trust ETF- IAU -Expense ratio .25% Or simply keep this component in physical gold held directly. Even with low expense ETFs, there is still a problem with this allocation. The problem is that all 4 areas are U.S. based which means you are putting all of your eggs into the American basket. Most people would see no problem with that today, since America is where the action is at. But the point of diversifying is to spread your risk out by not having it all in one place. Never forget the untimely proclamation made by Yale economist Irving Fisher, “Stock prices have reached what looks like a permanent high plateau… I expect to see the stock market a good deal higher than it is today within a few months.” This statement was made on October 19th, 1929, which was a mere 10 days before the infamous Black Friday. Just because things look promising today doesn’t mean that they will stay that way tomorrow. A lot can happen in a short time, and if a crash happens you wouldn’t want all of your portfolio exposed to the country where the crash takes place. The ETF choices for foreign diversification are not as vast as they are for domestic ETFs, but even with limited choices it could be easier than owning something like international bonds directly. Below is an example of such a portfolio: 25% iShares MSCI China ETF- MCHI 25% WisdomTree Asia Local Debt ETF- ALD 25% Australian Dollar Trust ETF- FAX 25% iShares Gold Trust ETF-IAU or physical gold You don’t want to just randomly pick a mix of countries, obviously Greek bonds and Russian rubles are not smart choices right now. Go for countries that have the least amount of economic/political chaos and that have decent reputations for economic freedom. Also, don’t spend the time back testing different ETFs in order to find the optimal allocation for the future. This defeats the whole purpose of admitting that you don’t know exactly how the future will play out. If you are ready to admit this, then the PP concept might be just for you.

Chart Of The Week: Bonds Versus Oil

Summary Important bottoms in crude oil have often matched important bottoms in Treasury yields. The bond market seems intrinsically stretched in context of its multi-decade progression. Long-term bonds are especially risky during the late stages of oil-market crashes. While many factors influence the bond market, it’s worth noting that cyclical bottoms in oil prices (NYSEARCA: USO ) have often matched cyclical bottoms in long-term Treasury (NYSEARCA: TLT ) yields. The oil crashes ending in March 1986, December 1998 and December 2008 are especially noteworthy. In all three cases, bond holders were severely clobbered after the free fall in oil prices ended. With the long bond currently near six-year-old resistance, it’s worth contemplating the damage that might be inflicted upon a reversal in the price of crude. Chart of the week: Oil prices versus long-term Treasury yields (click to enlarge) The bonus chart below presents a long history of 30-year U.S. Treasury prices expressed on log scale for comparability across time. In addition to the precarious set-up versus oil, the bond market seems intrinsically stretched in context of its multi-decade progression. The rally since December 2013 is “too steep, too fast.” The long bond seems to at least need a breather, and again, please note the tendency for sharp sell-offs following rocket-ship ascents. Bonus chart: 30-year Treasury prices (click to enlarge) Recap Important bottoms in crude oil have often matched important bottoms in Treasury yields. The bond market is currently stretched in context of its multi-decade progression. Long-term bonds are especially risky during the late stages of oil-market crashes. At this juncture, the two markets should not be contemplated independently. Now that you’ve read this, are you Bullish or Bearish on ? Bullish Bearish Sentiment on ( ) Thanks for sharing your thoughts. Why are you ? Submit & View Results Skip to results » Share this article with a colleague