Biotech Bio-Hazard
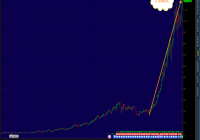
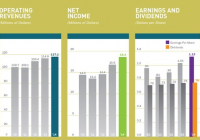
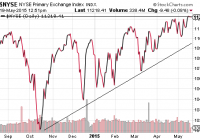
Summary Biotech stocks are very extended. IBB shares are vulnerable to a big sell-off. Every bubble bursts eventually. There has been a steady buzz around biotech stocks over the last few years but this buzz has reached a crescendo of late. It is a sector where a single FDA ruling can make or break a stock (or make or lose someone a fortune). M&A activity orchestrated by high-profile activists has created an environment of media coverage that’s put biotech stocks at the forefront of many investors’ minds. The money flowing into the sector hasn’t abated in years and while we might be in a golden era of biotech with amazing breakthroughs, many of the large biotech stocks have gotten way ahead of themselves. The sector looks a lot more like a top than a bottom to us and many of the stocks in the sector, including the iShares NASDAQ Biotechnology ETF (NASDAQ: IBB ), are due for a serious correction. BlackRock’s (NYSE: BLK ) IBB passively tracks the NASDAQ Biotechnology Index and this index has been on fire. Since Janet Yellen’s infamous overvaluation comments on the biotech sector a year ago, biotechs have rocketed 52% versus the NASDAQ up 20% and S&P 500 up less than 10%. Looking at many of the names in the biotechnology sector these days and I feel teleported back to 1999-2000. The IBB is the easiest way for an investor or fund to gain exposure to the biotechnology sector and with the volume and asset size explosion, IBB has helped fuel the biotech bubble itself. But IBB is not cheap, with a trailing P/E ratio of over 25. We fear owning IBB provides a false sense of security for investors who rely on the sector’s diversification. IBB is highly concentrated, with the top 4 holdings representing almost 31% of the fund. Expanding a bit further, the top ten holdings represent almost 58%. As the individual components continue to turn, the IBB could get hammered itself. Short interest has also been decreasing in the space’s big names recently, which is actually short-intermediate term bearish. Whoever has tried to short these names has probably met the same fate as those shorting the dotcoms in 1998, 1999 and even 2000. Shorting too early can lead to massive short squeezes later and we believe this, coupled with activist pressures, contributed to the biotechs big run last year. The decreasing short interest referenced above is no surprise as investors are simply too afraid (or broke) to try it anymore. IBB’s ‘Big Four’ Components Gilead (NASDAQ: GILD ) The biotech behemoth known as Gilead Science is the backbone of biotech’s ‘Big Four’ and has the largest weighting in IBB (almost 9%). It has disproportionately contributed to its frenzied appreciation. Gilead’s fundamentals have experienced phenomenal growth rates in revenues and operating margins (101% and 33% respectively). Arguably the most profitable blockbuster drug in history, its Hepatitis-C drug Sovaldi, has grown revenues from 0 in 2014 to $10.2 billion in 2014. The Hep-C market potential could be huge and some estimates predict a $32 billion market in 2018. So this is obviously been the main fuel in the rocket that is GILD. The good news is that the drug has around a 99% cure rate. The bad news is the drug costs about $84,000 for its treatment, lasting approximately three months. Some patient may even require another round of treatment. The stock has sold off before on pricing issues, only to snap back, but if pricing issues return and persist for Gilead, it could mean trouble for the stock. Unfortunately for GILD, backlash against over-pricing of biotech drugs is starting to gain traction. Hayman Capital’s Kyle Bass has shaken up the industry with his ‘Coalition for Affordable Drugs’. It essentially is trying to invalidate many drug company patents, most notably Pfizer (NYSE: PFE ), which could reduce prices for the public. Any battle where the fairness of evil, “price-gouging” big business opposes sick and dying individuals is sure to gain more media attention and partisan support. While Bass’s ‘Coalition’ hasn’t targeted Gilead or its patents yet, the risk to the sector is evident in other IBB components we’ll mention later. By requiring coverage of these uber-expensive drugs, health insurers are afraid they are going to get bankrupted by the biotech companies. The stage is set for a regulatory showdown. GILD is an extremely extended stock where almost all the fantastic growth rates and profits appear to be priced in (shown below). The company is such a darling that while researching for this article, I came across such bullish articles on Yahoo Finance titled “Why Gilead May be the Strongest Company in the World”. When a stock is as widely renowned (and owned) as articles like this suggest, the contrarian in us would rather be a seller than a buyer, because the stock has usually had its huge run already. And in fact, GILD shares have propelled almost sevenfold in about 3 ½ years. (click to enlarge) Amgen (NASDAQ: AMGN ) Based in Thousand Oaks, California, Amgen is the world’s largest independent biotechnology company, with a market capitalization of $119 billion. It has a huge pipeline of drugs ranging from rheumatoid arthritis to chemotherapy side effects. There has been lots of activist “investing” in Amgen, and the biotech space in general, which has undoubtedly helped fuel its run. But the tide may be turning somewhat. Dan Loeb had been invested in Amgen since just the second quarter of 2014 and AMGN was the biggest winner for his Third Point fund in 2014. But filings for Q1 2015 reveal, Third Point had no new buys in AMGN and actually sold 10,000,000 shares. Also, the well-respected John Hussman recently sold the remainder of his stake in AMGN. This is something we’ll keep an eye on. Biogen (NASDAQ: BIIB ) Biogen is a global biotechnology company, founded in 1978. It specializes in the discovery, development and delivery of treatment therapies of autoimmune and neurodegenerative diseases. With Nobel Prize winners among the company’s founders, its reputation is legendary. And the stocks amazing run over the years has reflected this. But with a trailing P/E of over 28 times, Biogen is no longer cheap, even after shedding almost 100 points from its high at $480. In fact, Biogen lost a quarter of its value in about 2 months, which is scary. This demonstrates how dangerously extended these stocks are and the potential effects if and when selling begins in earnest. It is interesting to note that Biogen is one of the stocks that Kyle Bass has named in his patent battle in April and look at the relative weakness and a possible new direction. Having successfully bet on the U.S. housing market debacle, we wouldn’t want to be standing in front of Bass or this trend. (click to enlarge) Celgene (NASDAQ: CELG ) Headquartered in my home state of New Jersey, Celgene became famous for its Revlimid and Thalomid drugs. Celgene also receives royalties from Novartis Pharma AG (NYSE: NVS ) on its family of Ritalin drugs to treat ADHD. But Celgene is also the most expensive of the Big Four with a trailing P/E ratio of over 38. (click to enlarge) There are other charts in IBB’s top ten holdings list with similarly extended charts, including Biomarin (NASDAQ: BMRN ), Mylan (NASDAQ: MYL ) and Alexion (NASDAQ: ALXN ). Again, the Top Ten holdings in IBB have a combined weighting of almost 58% of the ETF. While not one of the ‘Big Four’, its worth noticing below how stretched IBB’s #5 holding is- the cholesterol drug powerhouse, Regeneron (NASDAQ: REGN ). Regeneron’s weighting is almost as large as Celgene’s in IBB (in fact they repeatedly leapfrog each other for the #4 spot). It should also be noted that REGN has a market cap of about $50 billion yet had less than $3 billion in revenues last year. Lastly, hedge fund titan Ray Dalio of Bridgewater Associates sold the remainder of his Regeneron position in Q1 of this year. (click to enlarge) Is that a bell I hear? Incorporating ancillary events can place the last few puzzle pieces of an investment idea. The largest biotech IPO ever, Axovant (NYSE: AXON ), debuted last week. Very curiously, AXON has only one asset-a single Alzheimer’s drug it purchased for $5 million from GlaxoSmithKline (NYSE: GSK ). In addition, the company’s major investors, two hedge funds, have lock up periods of 90 days versus the normal 180 days for “insiders”. Here is some info from a WSJ.com article on Axovant: CNBC’s Bob Pisani has a column which also analyzes the IPO. In the article he posits, This is rather remarkable. Ramaswamy buys a drug Glaxo passes on for $5 million, turns around and raised $315 million in an IPO, and now has a company that is worth almost $3 billion. Does this amaze you? It amazes me. Either 1) Ramaswamy has made one of the great investments of all time and Glaxo has made a serious error passing on the drug, or 2) the company is overvalued. Very. We believe the answer is #2, however you slice it. Questionable IPOs harken back to the dotcom crash era. So where is IBB headed? In a word-lower. The historical (3-year) beat of 0.77 is understated and should rocket past 1 as the market sells off, which we expect over the next year. Given how quickly some of the top five holdings shaved a quarter of their market cap with a muted overall market disruption we believe IBB will break under $300 over the next 12 months and given the overextension of many of IBBs components, will probably do it by years end. Eventually, it will work much lower. Unlike many of IBB’s individual components, IBB itself pays a paltry 0.16 yield which becomes approximately a negative one-third of a percent after the funds expense ratio so holding a negative yielding security won’t weather a sell-off. Catalysts As odd as it may sound, a catalyst for the sell-off may be the financial stocks. When they start to sell-off or experience any type of credit crunch IBB should tank. The Top Five (concentration danger again) institutional owners of IBB are all financial institutions: (click to enlarge) Just these five firms own almost 10,000,000 shares of IBB which represents over 40% of IBB’s 24,000,000 share float. If they need to raise cash to maintain liquidity, IBB will be right near the top of the sell list. Even if the ownership numbers partially represent customers with accounts at these firms (whether individuals or more likely hedge funds that clear through the firms above), their buying power is basically exhausted. April was an all-time record level of NYSE margin debt: It is interesting to note the jump higher month over month. It looks like a last gasp to us and we interpret this as maximum buying (with maximum borrowed money) at or very near a market top. Conversely, the April margin number is almost 300% higher than right at the low of Q1 2009: This brings us to another unlikely catalyst for a sell-off in IBB, Apple (NASDAQ: AAPL ). The correlation between the IBB and AAPL has been remarkable. From CNBC.com , technical analyst Carter Worth mentions the connection: Such a tight correlation between such different sectors shows the overall correlations of the market converging and a high level of hot, trend-following money, in our opinion. With a weighting of over 14% in the NASDAQ 100 (NASDAQ: QQQ ), Apple has become a proxy for the market and fund flows in general. Apple’s concentration in various ETFs and indices is dangerous. Not to get too off-track, but Apple’s addition to the Dow Jones Industrial Average after its historic run is almost laughable and reminds us of a different ‘Big Four’ from the late 1990’s, Intel Corp (NASDAQ: INTC ), Microsoft (NASDAQ: MSFT ), Hewlett-Packard (NYSE: HPQ ) and Cisco Systems (NASDAQ: CSCO ). The first three all were added to the Dow in November 1999, when they seemingly could do no wrong (like AAPL). Cisco had its hand in every aspect of the internet and was a proxy for its growth. The stock then lost about 90% of its value, still being a fantastic company all the way down. Its stock just got way overextended. This could happen to an Apple or a Gilead very easily. As we commented last week, we believe AAPL has peaked and probably IBB and stock market as a whole. There are risks to our thesis, notably an increase in IBB’s short position as percentage of its float. Oddly, this contrasts what we read about the individual components of IBB’s short interest. This is telling, and we glean that investors are holding the individual components but hedging by shorting the IBB. Eventually, like Billy Joel portends, “they will all go down together.” Be Proactive Drastically trimming positions in these biotech high-flyers is a no-brainer and the safest choice if you’re worried about exposure at these levels. For those who can’t or won’t sell, there are some other choices. Since shorting the individual names is very dangerous (although not much more dangerous than being long them at this stage), shorting the IBB is probably the easiest way to hedge if you own some of the stocks mentioned above or similar ones in the sector. Another choice is buying put options on the IBB. Since the aforementioned high-flyers are major components of the IBB, your exposure should be hedged, at least partially. The options are very thinly traded, which is somewhat surprising. Expect volume and liquidity to increase in the options as the names sell-off hard. Below is part of the IBB options chain expiring January 2016 (approximately seven months from now): (click to enlarge) The closest strike price to IBB’s last sale is the $365 but the most liquidity is down at the round number $300 level where the open interest (amount of contracts outstanding) is greatest. The volume isn’t great in these options, to say the least, but this is from the close of Wednesday’s trading, after the IBB popped back up over 5%. This also demonstrates the overconfident mindset of investors in the sector and how little hedging is occurring on a big rebounding up day- just 22 put contracts in the shown strikes above! IBB put options could become the rage when the sector sell-off begins in earnest. There is also a levered, inverse ETF, the UltraShort NASDAQ Biotechnology (NASDAQ: BIS ). It’s small at $121 million of assets (versus $9 billion for IBB) and the slippage on these ETFs is always a concern. In the end, selling long is always the surest way to reduce exposure because you won’t have to worry about locates (or getting bought-in at the worst time), trying to navigate illiquid option spreads or an inverse ETF that may not track well. However you decide to execute, limiting exposure to biotech sector at this stage seems like an actionable and prudent idea from a risk-reward perspective. We leave you with one last picture: (click to enlarge) Disclosure: The author has no positions in any stocks mentioned, and no plans to initiate any positions within the next 72 hours. (More…) The author wrote this article themselves, and it expresses their own opinions. The author is not receiving compensation for it (other than from Seeking Alpha). The author has no business relationship with any company whose stock is mentioned in this article.


