Tag Archives: russia

Key ETF Performance Through President’s Day 2015

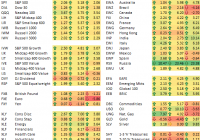
Below is a look at the performance of various asset classes through President’s Day 2015 using key ETFs from our daily ETF Trends report available to Bespoke Premium members. For each ETF, we show its performance last week, so far in February, and so far in 2015. US-related ETFs are generally on the left side of the matrix, while international, commodity and fixed income ETFs are on the right side of the matrix. US equities are up sharply so far in February, which has allowed them to erase January losses and move into the green for the year. The S&P 500 (NYSEARCA: SPY ) and Dow 30 (NYSEARCA: DIA ) ETFs are both up more than 5% in February, while the Nasdaq 100 (NASDAQ: QQQ ) is up 5.75%. Largecaps and midcaps are outperforming smallcaps year-to-date, while growth is outperforming value. Looking at the ten sectors, Energy (NYSEARCA: XLE ), Materials (NYSEARCA: XLB ), Telecom (NYSEARCA: IYZ ) and Consumer Discretionary (NYSEARCA: XLY ) are all up 7%+ this month already. On the flip side, the Utilities (NYSEARCA: XLU ) sector has plummeted this month, leaving it down more than 4% on the year. Outside of the US, most countries are in the green for the year, with the exception of Brazil (NYSEARCA: EWZ ), Canada (NYSEARCA: EWC ), Mexico (NYSEARCA: EWW ) and Spain (NYSEARCA: EWP ). The Russia ETF (NYSEARCA: RSX ) is up the most of any ETF in the matrix with a year-to-date gain of 23.38%. Commodities have been all over the place this year. Oil (NYSEARCA: USO ) is up 10% in February, but it’s still down 3.63% year-to-date. Gold (NYSEARCA: GLD ) is down 4.43% in February, but it’s up 3.87% YTD. Finally, fixed income ETFs have run into a rough patch over the last couple of weeks, especially the 20+Yr Treasury (NYSEARCA: TLT ) with a decline of 7.3% on the month. Even after the pullback, though, fixed income ETFs remain in the green on the year. Are you Bullish or Bearish on ? Bullish Bearish Neutral Results for ( ) Thanks for sharing your thoughts. Submit & View Results Skip to results » Share this article with a colleague
Ceasefire In Ukraine And The Oil Price Recovery: A Trend Reversal For The Russian Share Market

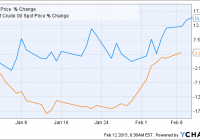
Summary If the cease-fire holds the political situation should start to calm down and the sanctions will be canceled or they will be let to expire. The technical analysis shows that the bottom was reached during December and January and now a major trend reversal should be coming. Most of the Russian companies are significantly undervalued, their P/E ratios should move higher after the political risk eases. The biggest threat is the oil price right now. If it starts to collapse again, the Russian share market rally will be only short-lived. It was reported by the news agencies that the leaders of Russia and Ukraine agreed on a cease-fire that should begin on February 15. It is a really good news for the whole region, assuming that the cease-fire will hold this time. It can represent a significant catalyst for the Russian share market. The Market Vectors Russia ETF (NYSEARCA: RSX ) is 15% higher year-to-date. Most of the gains were achieved during the last two weeks when the oil price started to recover. A prolonged oil price recovery along with a calm down of the political situation may lead to a significant recovery of the undervalued Russian shares. The Russian share market represented by RSX is down by more than 35% over the last 12 months. The main reasons are the oil price collapse, the political tensions between Russia, the western countries and Ukraine and the sanctions against Russia. If the mess around Ukraine is cleaned up, two of the three factors should be at least partially eliminated. From technical point of view it seems like the bottom was reached in the middle of December at $13.36. The share price is 26% higher now. The RSI reached the level of 15 back then but it has recovered very quickly. It is over 58 today and it keeps on growing. Also the moving averages start to signal a major trend reversal when we can expect that the 20-day SMA will surpass the 50-day SMA any day now. The table below shows the estimated P/E ratios of the 10 biggest RSX holdings. The weights are dated January 29, 2015 and the P/E ratios are dated February 12, 2015. As we can see most of the companies have a significant upside potential when we compare their P/E ratios to the P/E ratios of their foreign peers. It is hard to expect that the Russian P/E ratios will match the P/E ratios of the U.S. or European companies due to an increased political risk, but we can expect that the difference will decrease significantly after the political situation around Ukraine calms down. company weight in RSX (29.1.2015) estimated P/E (12/2014) Lukoil ( OTC:LUKFY ) 8.65% 4.6749 Gazprom ( OTCQX:GZPFY ) 7.43% 3.1890 Magnit 6.19% 20.911 Norilsk Nickel ( OTCPK:NILSY ) 6.08% 8.8119 Novatek 5.54% 13.8094 Sberbank ( OTCPK:SBRCY ) 5.32% 4.9904 Tatneft ( OTCPK:OAOFY ) 5.00% 5.4344 VTB Bank 4.96% 34.7950 Mobile TeleSystems (NYSE: MBT ) 4.31% 8.6266 Surgutneftegaz ( OTCPK:SGTPY ) 4.30% 2.1068 Source: own processing using data of Yahoo Finance and Bloomberg Conclusion The bet on the Russian market is still a risky one but the fundamental as well as technical factors start to indicate that it may start to pay off. If both Ukraine and the rebels will observe the cease-fire, the political situation should start to calm down and the sanctions against Russia will be canceled or they will be just let to expire. The technical indicators signalize a major trend reversal as well. The biggest threat is the oil price right now. If the oil price keeps on growing or if it at least doesn’t retest its recent lows, the recovery of the Russian share market should be quite quick. Disclosure: The author has no positions in any stocks mentioned, but may initiate a long position in RSX over the next 72 hours. (More…) The author wrote this article themselves, and it expresses their own opinions. The author is not receiving compensation for it (other than from Seeking Alpha). The author has no business relationship with any company whose stock is mentioned in this article. Are you Bullish or Bearish on ? Bullish Bearish Neutral Results for ( ) Thanks for sharing your thoughts. Submit & View Results Skip to results » Share this article with a colleague