Tag Archives: robo

A Year-End Review Of ROBO, The Robotics And Automation ETF

Summary The ETF’s percentage of large-cap holdings has declined by 9% since February 2014. Since February 2014, there has been an increase in riskier mid-cap, small-cap and micro-cap holdings within this ETF. Kuka AG and Krones AG are leading performers of the Robo Global Robotics and Automation Index ETF while Omron Corporation and Oceaneering International Inc. are leading laggards. The Robo Global Robotics and Automation Index ETF’s high expense ratio and increased exposure to riskier stocks makes the fund a risky investment. Just like Robin Roberts performs a year-end wrap-up of the year 2015, it is only appropriate that I perform a year-end analysis of the Robo-Stox Global Robotics And Automation Index ETF (NASDAQ: ROBO ) This exchange-traded fund was fortunate enough not to suffer the same fate as the now liquidated 3D Printing, Robotics and Technology Fund (MUTF: TDPIX ). As of the date of this article, the Robo Global Robotics and Automation Index ETF’s total YTD Performance was -4.73%. However, the funds has picked up momentum over the past three months with a gain of 10.54% over that span. Without further ado, it is time for me to perform an in-depth dissection of this fund. The Robo Global Robotics and Automation Index ETF has a high expense ratio of 0.95%. This is 0.30% higher than the expense ratio category average . The following chart illustrates the fund’s weight in terms of giant, large, mid, small and micro-cap stocks when I analyzed this fund in February 2014 . Size % of Portfolio Benchmark Category Average Giant 12.02 56.05 46.73 Large 17.80 21.14 13.74 Medium 40.85 17.44 25.91 Small 13.39 5.24 10.90 Micro 15.94 0.13 2.73 As you can see by the following chart, the percentage of large-cap holdings in the fund has declined by over 9% from nearly two years ago and is well below its category average. Meanwhile, you can see that there has been a percentage increase in the mid-cap, small cap and micro-cap stocks of this fund. These statistics are as of 12/23/2015. Size % of Portfolio Benchmark Category Average Giant 11.22 42.29 3.56 Large 8.79 31.26 28.17 Medium 44.89 19.80 52.11 Small 18.09 6.24 12.66 Micro 17.01 0.41 3.50 LEADERS OF ROBO GLOBAL ROBOTICS AND AUTOMATION INDEX ETF In terms of coming up with the top performers in the fund, I took into account both the portfolio weight and YTD Return of the holdings. KUKA AG ( OTCPK:KUKAF ) = KUKA AG is an automation firm that develops and gives sells robotic systems internationally under the KUKA brand. KUKA AG has the 8th best portfolio weight at 2.14%, yet had an YTD return of 37.10%. Currently, KUKA AG is trading at $87.74 and is coming off of a solid third quarter performance . KUKA AG’s garnered a 25% in orders received and a 34% increase in sales revenues. These increases included totals from the Swisslog division, which was not consolidated in the previous year. The firm’s robotics division increased by 20% in terms of orders received, yet its sales revenues declined by 7% for the quarter. According to its report, KUKA AG have benefited from increased car sales in its three biggest markets, Western Europe, China and the U.S. Car sales in Western Europe, China and The U.S grew by 8.7%, 5.5% and 5% respectively for the first nine months in 2015. KUKA expects to benefit from further growth in these markets. KRONES AG ( OTC:KRNNF ) – Krones AG is responsible for the planning, developing and manufacturing machinery and systems for the process technologies and intralogistics arena in Germany as well as worldwide. Krones AG has a 2.06% portfolio weight and has an YTD return of 34.35%. Krones is trading at $108.25. Its latest report revealed that Krones AG was right on target in terms of meeting its target objectives. Krones AG’s revenue and net orders has increased by 4.9% and 5.2% respectively. The firm’s EBIT, EBT and Net Income increased by 14.8%, 14.2% and 13.9% respectively. LAGGARDS OF ROBO GLOBAL ROBOTICS AND AUTOMATION INDEX ETF It would be easy for me to point the finger at the struggling 3-D Printing stalwarts of 3D Systems Corp (NYSE: DDD ) and Stratasys (NASDAQ: SSYS ). Both have YTD Returns of -69.29% and -69.12%. However, both holdings hold portfolio weights of less than 1%. Thus, both holdings do not hold enough significance to the fund at this point. However, Omron Corporation (OMR) has a hefty portfolio weight of 2.12% and has a negative YTD Return of -22.50%. In their latest half-year report, Omron Corporation’s revenue increased year-over-year by 2.2%. Yet, the company’s net income declined by -27.3% to $24.5 million dollars. Omron’s operating income was dragged down by a mix of increased SG&A and R&D and lower added value. Oceaneering International Inc. (NYSE: OII ) has a sizable portfolio weight of 1.74% and has a YTD return of -33.79%. Oceaneering International Inc. just hit a new one-year low on Dec 21st. This came on the heels of Oceaneering International Inc. being downgraded to a Strong Sell by Zacks. In the company’s latest report, Oceaneering International Inc’s reported a 31% decrease in net revenues and an 81% decline in net income. BOTTOM LINE: I still cannot give this ETF my full endorsement as an investment as it is still overly exposed to riskier stocks as shown by the chart comparisons above. In addition, Morningstar rates this fund zero stars and has an F rating by ETF.com. The fund’s high expense ratio of 0.95% is an even bigger turnoff. Editor’s Note: This article discusses one or more securities that do not trade on a major U.S. exchange. Please be aware of the risks associated with these stocks.

Robotics Fund Faceoff: ROBO Vs. TDPNX

Summary Automation and robotics are poised to breakout from factories and drive growth in a multitude of industries. Many pure play companies in the field are small or listed overseas, making a fund approach attractive. With lower costs and a more diversified portfolio, ROBO has the edge in this nascent investment arena. Advances in technology as well as economic and social factors are making automation and robotics more feasible for a growing number of companies in a wide assortment of industries. Self-driving cars, drone package deliveries, 3D printing and robot-assisted surgery were once the purview of science fiction. Today, these scenarios are becoming a reality. While industrial automation has been commonplace for decades in developed economies, reduced costs are now making it a viable option in the developing world as well. Once used to replace dangerous, dirty and labor-intensive jobs, automation and robots are being integrated into more aspects of an increasing number of jobs due to advances in tracking sensors, machine controls, nanotechnology and programming. In addition to industrial applications, automation and robotics are also used to deliver needed social services and help people live independent lives. Social, economic and technological trends are pushing advances in the development and integration of automation and robotics. While still in its infancy, the automation and robotics sector offers long-term investment potential. One way to invest in this burgeoning sector is the Robo-Stox Global Robotics And Automation Index ETF (NASDAQ: ROBO ). Another option is the 3D Printing, Robotics and Technology Fund Inv which has two classes of shares. The fund’s institutional class shares trade under the ticker symbol TDPIX while the investor class utilizes the ticker symbol TDPNX . Robo-Stox Global Robotics and Automation Exchange Traded Fund ROBO is a Science and Technology Fund that seeks to replicate the price and yield performance, before fees and expenses, of the ROBO-STOX Global Robotics and Automation Index. The ETF normally invests at least 80 percent of assets in securities contained within the index, which is formulated to measure the performance of companies primarily engaged in or supporting robotics and automation. Securities within the index have a market capitalization in excess of $200 million and a 1-year trailing daily trading average volume of $200,000. The index is divided into four basic categories. This include industrial robots, service robots for government and corporate use, personal- and private-use robotics and firms engaged in supporting robotics and automation. The weight of each category may vary. Managers determine which stocks are deemed bellwether due to their ability to indicate or lead trends for the market segment. The fund maintains a 40 percent weighting in these bellwether securities and 60 percent in non-bellwether shares. The non-diversified ETF utilizes a passive investment philosophy. Of the $100 million in assets in the fund, 38 percent are invested in and 62 percent is invested in foreign issues. In addition to the U.S. and Japan, the ETF has exposure to Developed Europe and Developed Asia. The fund is heavily weighted toward industrial, information technology and healthcare sectors. With an average market cap of $2.7 billion, the fund has 9.9 percent exposure to giant cap companies as well as an 11 percent and 45 percent exposure to large and mid-cap stocks. The fund also holds 17.41 percent and 16.56 percent allocations in small- and micro-cap shares respectively. As of October 15, ROBO had a P/E ratio of 18.05 and a price-to-book of 1.74. The largest holding in ROBO has only 2 percent of assets, making for a well-diversified portfolio. Many holdings in the fund are familiar names that may not make one think of automation, such as Deere (NYSE: DE ), but thanks to the fund’s small allocation in each holding, there’s a lot of pure play exposure to companies such as Mobileye (NYSE: MBLY ), a company working on driverless vehicles. 3D Printing, Robotics and Technology Fund TDPNX seeks long-term capital appreciation by investing at least 80 percent of assets in securities issued by domestic and foreign companies in developed as well as emerging markets engaged in 3D printing, robotics and automation regardless of their market cap. Fund advisers use a top down approach to determine potential candidates for inclusion in the portfolio. A bottom up approach is then utilized to select the stocks for actual investment within the portfolio focusing on factors like company fundamentals and growth prospects within the industry. TDPNX changed its mandate and name in July 2015 due to losses in 3D printing shares, which it was its exclusive focus until then. The fund’s new name and portfolio reflect its branching out into robotics as the 3D printing stocks dipped into a bear market. The new focus is designed to capitalize on the growth in both of these fast growing segments, while avoiding concentration in the narrow slice of the economy. The fund holds 47 percent of assets in domestic stocks and 44 percent in foreign shares. In addition to the U.S., TDPNX has significant exposure to Developed Europe and Greater Asia, primarily Japan. The portfolio has a 16 percent weighting in giant cap stocks as well as 17, 21, 22 and 24 percent weightings in large-, medium-, small- and micro-cap stocks respectively. The fund’s average market cap is $4 billion. The portfolio has a P/E ratio of 25.3 and a price-to-book of 2.21. Fund Comparison ROBO has outperformed TDPNX since the inception of the latter in April 2014. TDPIX has declined 23 percent over its life, while ROBO is down approximately 11 percent over the same period. Since changing its mandate in July, TDPNX has outperformed ROBO, losing 6.5 percent versus ROBO’s 11 percent decline-but it’s much too short a period to draw a conclusion from. ROBO is a fund that delivers on its name. The fund’s extensive holdings include companies involved in robotics, from traditional companies within the industry to those new in emerging sectors, such as unmanned vehicles and medical fields. The top holding in ROBO has barely more than 2 percent of the fund’s assets, and the top 10 have less than 22 percent of total assets. The top 10 in TDPNX accounted for 47 percent of assets as of June 30. TDPNX is a broad fund but makes more concentrated investments. The 3D Printing Fund has only 46 holdings compared to the 82 separate investments within the ROBO portfolio. TDPNX also counts large caps such as Hewlett-Packard (NYSE: HPQ ) and General Electric (NYSE: GE ) among its top ten, diluting some of the pure play exposure (the fund reports it has 46 percent pure play exposure ), but this explains why the fund outperformed ROBO over the past three volatile months. (click to enlarge) TDPNX is the more expensive fund. The Institutional Class has a net expense ratio of 1.25 percent while the investor class’ net expense ratio is 1.50 percent. The fund’s adviser has contractually agreed to waive management fees and/or reimburse expenses through April 15, 2016. Shares are subject to a fee of 2 percent when redeemed within 60 days of purchase. ROBO charges 0.95 percent and is subject to brokerage trading fees like most other ETFs. Conclusion The long-term prospects for automation are better than ever as automated software and hardware are ready to move off the factory floor and into the home, office and highways. Investors who take an aggressive approach can achieve broad exposure with the aforementioned funds. The mandate shift by TDPNX is a good one and makes for a more conservative fund, but this niche segment of the economy will be highly volatile even with some exposure to a Dow component such as GE. ROBO is therefore the more attractive fund for now, in addition to being cheaper and offering broader exposure, but the ETF suffers from low volume. The risk isn’t so much in getting in, but in getting out in the event investors rush to the exits. We saw ETFs suffer flash crashes in August and ROBO was among them. Investors can make ROBO a small niche holding in a diversified portfolio, but be prepared for rollercoaster rides during periods of high market volatility.

Schwab Intelligent Portfolios: Intelligent Investing Or Marketing Hype?

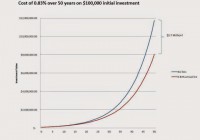
Summary Schwab has joined the rapidly growing robo-adviser market with its “Schwab Intelligent Portfolios.” Cash drag can dramatically diminish investor returns. Smart beta does not live up to its hype of superior returns. “No adviser fee” is just a marketing hype that can cost an investor millions of dollars when cash drag and ETF expenses are taken into account. Schwab Intelligent Portfolios won’t be a game changer for many reasons. Due to the increasing popularity of robo adviser investing, Charles Schwab (NYSE: SCHW ) has entered this market with its introduction of Schwab Intelligent Portfolios . For a minimum of $5,000 initial investment, Schwab sets an asset allocation using ETFs and rebalances the portfolio periodically. For a minimum of $50,000, a client may elect tax loss harvesting by the program. No adviser fees are charged on top of the fees charged by the ETFs. Is this a game changer? Should you enroll? How much will it cost? One major implicit cost is cash drag. Schwab Intelligent Portfolios hold 6-30% of assets in cash, allowing Schwab to earn the spread between the interest it pays on the cash deposits (currently around 0.12%) and investment income from such deposits. Assuming average stock market return of around 10%, a 6-30% cash allocation costs 0.6-3% annually ! That is at least twice as much as the 0.3% annual adviser fees charged by other similar robo adviser programs, as stated in Schwab’s disclosure . For comparison, neither Wealthfront nor Betterment mandate cash allocations. After all, if I want to hold cash, why do I need to give it to a robo adviser? While Schwab pays only 0.12% on cash deposits, you can earn over 8 times as much with a high yield savings account , which also allows you to withdraw money anytime. This implicit 0.6-3% annual fee from cash drag belies Schwab’s claim as a no-fee robo adviser. But that is not all. The ETFs selected have fees of their own. The asset allocation recommended is based on risk tolerance and investment horizon. The lowest cost asset allocation possible, recommended with the highest risk and return potential, and minimum 6% cash allocation, is shown below: Stocks 94% Probable ETF Expense U.S. Large Company Stocks 11% SCHX 0.04% U.S. Large Company Stocks – Fundamental 17% FNDX 0.32% U.S. Small Company Stocks 7% SCHA 0.08% U.S. Small Company Stocks – Fundamental 11% FNDA 0.32% International Developed Large Company Stocks 9% SCHF 0.08% International Developed Large Company Stocks – Fundamental 13% FNDF 0.32% International Developed Small Company Stocks 4% SCHC 0.18% International Developed Small Company Stocks – Fundamental 6% FNDC 0.48% International Emerging Market Stocks 4% SCHE 0.14% International Emerging Market Stocks – Fundamental 6% FNDE 0.47% U.S. Exchange-Traded REITs 4% SCHH 0.07% International Exchange-Traded REITs 2% VNQI 0.24% Cash 6% 0.00% Total 100% 0.23% Schwab will likely use its own funds whenever possible, but may switch to other funds under its program as part of tax loss harvesting. While the fees of traditional Schwab cap-weighted index funds are among the lowest in the mutual fund industry, the fees of fundamental index ETFs are much higher, as seen above. The net result is an additional 0.23% annual fee for the overall portfolio. In sum, Schwab Intelligent Portfolios cost at least 0.83% of assets annually . That does not account for costs associated with capital gains tax and bid-ask spread for periodic rebalancing. What is the effect of a 0.83% annual expense? Due to the effect of compounding, an investor will lose 14% of their assets in 20 years, 20% in 30 years, 26% in 40 years, and 32%, or almost a third of their potential wealth, in 50 years. As shown by the following graph, $100,000 invested over 50 years earning 10% return will grow to $11.7 million, but the investor paying 0.83% fee would end up with only $8.0 million, losing $3.7 million to fees over the years. (click to enlarge) Do fundamental index funds offer higher returns, thereby justifying their higher fees? The research suggests no. The table below shows that such so-called smart beta funds actually underperform the market: Smart beta funds vs. S&P 500 Name 3-year annualized total return 5-year annualized total return 10-year annualized total return Net expense ratio Strategic beta ETFs* 13.33% 12.5% 7.9% 0.48% Strategic beta mutual funds** 18.17% 13.69% 6.98% 1.17% S&P 500 index 20.42% 15.45% 7.67% Source: Morningstar. Returns are through Dec. 31, 2014. *Results from 394 strategic beta exchange-traded funds covered by Morningstar. **Results from 43 strategic beta open-end mutual funds covered by Morningstar. Fundamentally weighted indices have outperformed traditional capitalization-weighted indices by greater allocation to value stocks and small size stocks. ETFs and mutual funds constructed from fundamental indices, however, fail to live up to their promise of superior returns, mainly due to higher expense ratios and turnover costs. As John Bogle famously said about investing: You get what you don’t pay for. Impact on the Robo Advisor Industry Adam Nash, CEO of Wealthfront, wasted no time to attack Schwab’s new robo advisor program as a marketing gimmick by presenting something as no fee that was in fact high cost. Schwab was equally quick to issue a response , arguing that cash is actually an investment and the interest rate will eventually rise, that fundamentally weighted indices have historically delivered excess returns, and that the 0.25% advisor fee charged by Wealthfront is a real sunk cost. Betterment also wrote an article to attack Schwab’s program as costly due to cash drag . It is revealing that both Wealthfront and Betterment, the two leaders in the robo advisor industry, each with over one billion dollars in assets under management (AUM), felt compelled to respond with such rapidity. They clearly felt threatened. And rightly so. Most investors too lazy to manage their own investment portfolio and willing to pay 0.15-0.25% advisor fee that Betterment and Wealthfront charge will probably not look too closely at the real cost of cash drag, but rather be attracted by the superficial charm of Schwab posing as a “no fee” advisor. Robo advisor services, which are new technologies, mainly appeal to younger investors, who tend to like free things and new, fashionable things, such as smart beta, one of the latest financial innovations. It is probably inevitable that Schwab will take away some market share in the robo advisor industry. Nonetheless, the products offered by the three robo advisors are differentiated enough to have their own moats. Below are the highest risk and return portfolios from Wealthfront and Betterment: Wealthfront: Asset ETF Allocation Expense ratio U.S. Stocks VTI 35% 0.05% Foreign Stocks VEA 22% 0.09% Emerging Markets VWO 28% 0.15% Dividend Stocks VIG 5% 0.10% Natural Resources DJP 5% 0.75% Municipal Bonds MUB 5% 0.25% Total 100% 0.13% Betterment: Asset ETF Allocation Expense ratio U.S. Total Stock Market VTI 16.2% 0.05% U.S. Large-Cap Value VTV 16.2% 0.09% U.S. Mid-Cap Value VOE 5.2% 0.09% U.S. Small-Cap Value VBR 4.5% 0.09% Developed Markets VEA 37.5% 0.09% Emerging Markets VWO 10.5% 0.15% Municipal Bonds MUB 5.5% 0.25% U.S. Corporate Bonds LQD 0.6% 0.15% International Bonds BNDX 2.4% 0.19% Emerging Market Bonds VWOB 1.6% 0.34% Total 100.2% 0.11% For some reason, probably due to rounding error, the Betterment allocations don’t exactly add up to 100%. The table below summarizes the differences between the three portfolios. Schwab Wealthfront Betterment Stocks 92% 89% 89% Bonds 0% 5% 10% Cash 6% 1% 1% Alternatives 2% 5% 0% U.S. Stocks 52% 40% 41% Foreign Developed Market 33% 26% 38% Emerging Market 7% 23% 10% Value 58% 59% 58% Growth 42% 41% 42% Large Cap 59% 81% 76% Mid/Small Cap 41% 19% 24% Price/earnings 17.5 16.14 16.26 Price/book 1.81 1.94 1.79 Return on equity 14.61 18.21 16.61 Average Market Cap 16.0B 29.3B 29.0B Expense ratio 0.24% 0.13% 0.11% Number of Holdings 13 6 10 Overall stock allocation is similar, with Wealthfront and Betterment both at 89%, while Schwab is slightly higher at 93%. The rest is mostly in cash for Schwab, partly in bonds and partly in alternatives for Wealthfront, and mostly in bonds for Betterment. In terms of allocation to world regions, Schwab is U.S. centric. Wealthfront has a significantly higher allocation to emerging markets at 23%. All three are similar in value versus growth allocation. Schwab has significantly higher allocation to small cap stocks. The price ratios are similar for all three. Schwab has a significantly higher expense ratio, twice as much as its competitors; it also has the higher number of holdings in its portfolio. Wealthfront would appeal to investors who prefer simplicity (the portfolio has only 6 holdings), emerging markets, and alternative investments. Betterment would appeal to cost conscious investors. Schwab would appeal to investors who prefer complexity, small cap, smart beta, and tax loss harvesting (more holdings create more opportunities for tax loss harvesting). But the $64,000 question is, will this be a game changer? I doubt it, for several reasons. First, the robo advisor market is relatively small within the entire asset management business. Even if Schwab could reach $1 billion AUM, at 0.83% fee, that would still generate only a tenth of one percent of Schwab’s 2014 revenue of $6.157 billion, too small to move the needle. Second, Schwab Intelligent Porfolios might even eat into Schwab’s high margin core business, as it could cause Schwab clients using traditional advisor services and expensive actively managed mutual funds to switch over to Schwab’s robo advisor service, causing loss of revenue. Third, robo advisor service may not be a sustainable business model, as it has never been tested under bear market conditions. Young investors confident in a bull market may not feel so confident when the next bear market comes, especially without the hand-holding and long-term relationship of a personal investment advisor, causing funds to go out as fast as they had come into the robo advisor industry. Fourth, investors will probably come to the realization that cash drag is a significant hidden cost, and Schwab Intelligent Portfolios may end up being a total flop. Finally, even if Schwab does succeed in gaining market share and the industry continues to grow, the success itself will attract fierce competition from yet bigger firms, such as Merrill Lynch, ultimately driving profits down. Even though Schwab’s new robo advisor service would not alter Schwab’s fundamentals, robo advisor service is a Wall Street fad worth paying attention to for the enterprising investor. If Schwab succeeds in penetrating the market, it could generate undue optimism, creating good selling opportunities. Watch for its growth in AUM relative to the competitors, new market entrants, and how it handles a bear market. If the new robo advisor service fails, on the other hand, it could generate undue pessimism, leading to a selloff in Schwab’s stock, creating good buying opportunities. Conclusion Don’t fall prey for the marketing hype of Schwab’s “no fee” robo investing. One should hold enough cash as an emergency fund for 6 months worth of living expenses, but not in an investment portfolio meant to last 20 years or more. Put the cash in a high yield savings account, where you can earn over 8 times as much interest, and be able to withdraw anytime you want, rather than be forced to hold at least 6% cash at all times. Forget about smart beta. For higher returns, allocate more to value and small cap, and minimize costs. Schwab Intelligent Porfolios is good marketing, but it won’t be a game changer. Whether or not it succeeds, the potential market is too small to move the needle for Schwab; nonetheless, its success or failure may create price discrepancies for the enterprising investor to exploit. Disclosure: The author has no positions in any stocks mentioned, and no plans to initiate any positions within the next 72 hours. (More…) The author wrote this article themselves, and it expresses their own opinions. The author is not receiving compensation for it (other than from Seeking Alpha). The author has no business relationship with any company whose stock is mentioned in this article.