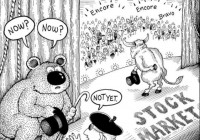
Risk? What Risk?
By Dominique Dassault Equity Risk Is Increasingly Non-Existent… By The Numbers The concept of risk for hedge fund managers is a constant concern. The internal monologue goes something like this…”what’s my downside if I initiate this position… how much can I lose if I am not right?” The real answer is that you really have no idea… despite best efforts… even with stop losses [which I abhor]. The true, measurable risk of any position is only exactly known after you liquidate the position. Plus, risk management is more capital management than single stock management. Little did he know how it would all end… Cartoon via wallstreetsurvivor.com How much capital are you assigning to each position in the context of the entire portfolio capital? And are your different positions correlated or not? Even if they are [not], historically, there is no guarantee that correlation [or not] will continue. Anyway… back to risk. Every day my prime broker blasts me with a report loaded with scores of trading metrics calculated over many time frames [mostly the last twelve months]. It is all very interesting but the only real metrics I care to focus on are total returns and risk-adjusted returns. Most clients could not care less about risk-adjusted returns… but I sure do. And, as many are aware, the holy grail of risk metrics is the Sharpe Ratio [as calculated according to the title of this post]. The most interesting precept of the Sharpe Ratio, in my opinion, is that it treats volatility as random… both upside and downside volatility. No way to predict it in either direction so both directions are assigned the same discounting value. Basically, according to Bill Sharpe, all volatility is a penalty against your performance. I get it. Still, in a perfect world, what if most of the volatility experienced by a portfolio of equities was actually favorable? So rare… if not impossible… but still at least worthy of consideration. And so the Sortino Ratio [or as I refer to it as the Gain/Pain Ratio] was born… essentially, it is exactly as the Sharpe Ratio but stratifies favored and unfavored volatility. Favorable volatility is not penalized. Unfavorable volatility is scored as a legitimate demerit. It has always seemed fairer to me. (click to enlarge) The difference between the Sharpe and Sortino ratios Naturally, both ratios are relevant and higher values for both measurements reflect better risk-adjusted returns. And portfolio managers realize that, no matter the ratio, both need to be positive…or you are losing money. However, given full investment of capital, the Sharpe Ratio can be strongly positive yet still not offer high absolute returns. Conversely, if your Sortino Ratio is high, you are probably delivering very strong absolute returns… again, assuming full investment of capital. An Era of Painless Gains Given all of this… What is a good numerical value for both ratios? Generally, over time, any value > 1.5 is pretty good and numbers > 2.0 are stellar. Be advised the data may vacillate, a little bit, based on the time frame used in your calculation i.e. weekly or monthly. Recently, I constructed a model that required one, three and five-year Sharpe Ratios for the S&P 500. I also decided to include the Sortino Ratio. Prior to the results, I hypothesized that the numbers ought to be pretty impressive given the endless equity “bull” since March 2009, but I was still curious to get the exact data. Plus, a weekly price chart of the S&P 500, since 2009, visually reflects the anomaly of very limited drawdowns in the context of extremely strong returns. The calculations are as follows and as Mrs. Doubtfire once said…”Effie… Brace Yourself.” Sharpe Ratio 1-Year = 1.37 3-Year = 1.86 5-Year =1.0 Sortino Ratio 1-Year = 2.65 3-Year = 3.41 5-Year = 1.69 Collectively, these numbers are clearly impressive but even more so in that they are calculated from a passive, long only strategy. This is a hedge fund manager’s worst nightmare as, for five years, most “hedging” has proved to be only performance degrading. (click to enlarge) S&P 500 index – since the 2009 low, hedging has essentially just been a performance drag, with the possible exception of the 2011 correction. Furthermore, the Sortino Ratio data are nothing short of staggering. What they really say = Plenty of Gain with Very Little Pain … and it really is unsustainable if only because it has become much too easy to generate positive returns with very little effort, pain or savvy. To the Ignorant the Spoils It actually seems, at times, as though there is this mysteriously large buyer that suddenly appears whenever the equity market most “needs it”… and the subsequent buying is so aggressive and so desperate… not the style of the mostly steady “hands” I personally know. It just seems too good to be true and the Sortino Ratio numerically reflects that belief. Plus, we all know that the economic fundamentals are not as smooth as the weekly or monthly charts of the S&P 500 would suggest. Remember that equities typically offer the most risk of any asset class… not the lowest risk as the above data set suggests. Nevertheless, Yellen and Bernanke must be “psyched” as their “wealth effect” model has been so effective… actually too effective as the market distortions grow ever larger… and more market bears become contorted “road-kill.” To be sure these distorting effects may be entirely assigned to The Fed… the debt monetizing, interest rate suppressing “Masters of the Universe” who always get what they want while answering to nobody. They’ve literally trounced and expectorated on the concept of “moral hazard” and, it seems, purposely reconfigured and redefined its meaning into: We have no economic morals and this poses an enormous hazard to the performance of hedged money managers. The spoils go to the ignorant only – the Fed’s true heroes. Charts by: Advisor Central, BigCharts
