Tag Archives: prpfx

Revisiting 10 Asset Allocation Funds Amid Market Turmoil

Earlier this year, I reviewed ten asset allocation mutual funds with a range of strategic designs as an academic exercise for exploring how multi-asset strategies stack up in the real world. Seven of the ten funds post losses for the trailing one-year period through yesterday (Sept. 22), along with one flat performance and two modest gains. One lesson in all of this is that investment success (or failure) is usually driven by two key factors: asset allocation and the rebalancing methodology. For the elite who beat the odds, the source of their success is almost certainly bound up with superior rebalancing methodologies that shine when beta generally takes a beating. Earlier this year, I reviewed ten asset allocation mutual funds with a range of strategic designs as an academic exercise for exploring how multi-asset strategies stack up in the real world. Not surprisingly, the results varied, albeit largely by dispensing a variety of gains as of late-February. But that was then. Thanks to the recent spike in market volatility (and the slide in prices), a hefty dose of red ink now weights on these funds. Seven of the ten funds post losses for the trailing one-year period through yesterday (Sept. 22), along with one flat performance and two modest gains. This isn’t surprising considering the setbacks in risky assets over the last month or so. But the latest run of weak numbers is also a reminder that asset allocation comes in a variety of flavors and the results can and do vary dramatically at times. One lesson in all of this is that investment success (or failure) is usually driven by two key factors: asset allocation and the rebalancing methodology. Of the two, rebalancing is destined to be a far more influential force through time. Assuming reasonable choices on the initial asset mix, results across portfolios – even with identical allocation designs at the start – can and will vary by more than trivial degrees based on how the rebalancing process is executed. And let’s be clear: it’s no great challenge to select a prudent mix of asset classes to match a given investor’s risk profile, investment expectations, etc. Tapping into a solid rebalancing strategy (tactical or otherwise) is a much bigger hurdle. But at least there’s a solid way to begin. For most folks, holding some variation of Mr. Market’s asset allocation strategy – the Global Market Index, for instance – will do just fine as an initial game plan. The choices for tweaking this benchmark’s design will cast a long shadow over results if the weights are relatively extreme – heavily overweighting or underweighting certain markets, for instance. Otherwise, the details on rebalancing eventually do most of the heavy lifting, for good or ill as time rolls by. With that in mind, we can see that most of our ten funds have had a rough ride recently. The reversal of fortune has been especially stark for the Permanent Portfolio (MUTF: PRPFX ) this year. After leading the pack on the upside in April and May (based on a Sept. 23, 2014 starting point), the fund has since tumbled and suffers the third-worst slide among the ten funds for the trailing one-year return. (click to enlarge) At the opposite extreme, we have the Bruce Fund (MUTF: BRUFX ) and the Leuthold Core Investment Fund (MUTF: LCORX ), which are ahead by around 3.5% for the past 12 months. Those are impressive results vs. the rest of the field. Note the relative stability for BRUFX and LCORX over the past month or so. Is that due to superior rebalancing strategies? Or perhaps the funds beat the odds by concentrating on asset classes that fared well (or suffered less) in the recent and perhaps ongoing correction? We can ask the same questions for the other funds in search of reasons why performance suffered. In any case, the answers require diving into the details. A good start would be to run a factor-analysis report on the funds to see how the risk allocations compare. Another useful angle for analysis: deciding how much of the performance variations are due to what might be considered asset allocation beta vs. alpha. A possible clue: BRUFX’s longer-run results are also impressive while LCORX’s returns are relatively mediocre in context with all of the ten funds, as shown in the next chart below. Is that a hint for thinking that BRUFX’s managers have the golden touch in adding value over a relevant benchmark? Maybe, although the alternative possibility is that the fund is simply taking hefty risks to earn bigger returns. In that case, the risk-adjusted performance may not look as attractive. Perhaps, although several risk metrics (Sharpe ratio and Sortino ratio, for instance) look encouraging and give BRUFX an edge over LCORX, according to trailing 10-year numbers via Morningstar. (click to enlarge) Meanwhile, keep in mind that an investable version of the Global Market Index – a passive, unmanaged and market-weighted mix of all the major asset classes – is off by roughly 5% for the trailing one-year period. That’s a middling result relative to the ten funds, which isn’t surprising. In theory, a market-weighted mix of a given asset pool will tend to deliver average to modestly above-average results vs. all the competing strategies that are fishing in the same waters. In other words, most of what appears to be skill (or the lack thereof) is just beta – even for asset allocation strategies. But there are exceptions. That doesn’t mean that we shouldn’t customize portfolios or study what appear to be genuine advances in generating alpha in a multi-asset context. But as recent history reminds once again, beating Mr. Market at his own game isn’t easy. But for the elite who beat the odds, the source of their success is almost certainly bound up with superior rebalancing methodologies that shine when beta generally takes a beating.
The Permanent Portfolio Is Dead

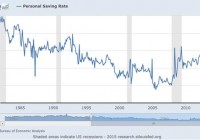
Summary Permanent Portfolio has underperformed U.S. stocks, and several stock/bond allocations, since 2012. Gold has delivered most of Permanent Portfolio’s gains since 2007; as gold underperformed since 2012, so has the Permanent Portfolio. Permanent Portfolio worked in an age of booming credit-based consumption, but does not work in an age of secular stagnation. Even if we aren’t in an age of secular stagnation, the permanent portfolio’s three-year underperformance indicates that it is no longer permanent, and is best avoided. If you’ve never heard of the permanent portfolio, consider yourself lucky. If you have heard of it, I’m sorry to tell you this: it’s not permanent anymore. Which means it really never was. That doesn’t mean it had a great run, but the run is over and it’s time to move on. What is the Permanent Portfolio? The permanent portfolio was first designed by investment analyst and libertarian politician Harry Browne, who called it a “fail-safe” investment. The idea was simple enough to appear elegant: a portfolio of equal weightings of four asset classes: * 25% U.S. stocks-e.g., the SPDR S&P 500 Trust (NYSEARCA: SPY ) or Vanguard Total Stock Market ETF (NYSEARCA: VTI ) * 25% long-term Treasury bonds-e.g., the iShares Barclays 20+ Year Treasury Bond Fund (NYSEARCA: TLT ) * 25% cash-e.g. the Short Treasury Bond ETF (NYSEARCA: SHV ), or just cash * 25% precious metals (specifically, gold)-e.g. the SPDR Gold Trust ETF (NYSEARCA: GLD ) The stocks were for times of prosperity. The bonds were for times of deflation, the cash was for times of recession, and the gold was for times of inflation. An equal weighting of all of these, the theory went, would protect an investor from any one scenario and outperform a focus on any one asset class. Harry Browne dreamed up the permanent portfolio in 1982 when rampant inflation was eating into everyone’s purchasing power and stagnant economic growth was crimping most people’s ability to earn and save. Shortly after Browne’s vision, the U.S. gave up its steady savings rate and learned to love credit cards, causing the national savings rate to plummet: (click to enlarge) The 1980s were a time of high inflation and strong stock growth, providing tailwinds for Browne’s brainchild. Those who followed Browne’s lead had market-beating returns and shockingly little volatility. According to Crawlingroad.com , the permanent portfolio had a 11.5% average return from 1982 to 1990, and no negative years (it did however have a negative return in 1981 due to a 32.9% drop in gold). Backtesting the strategy, we see only three years of negative returns since 1971: Even more impressively, the permanent portfolio managed a positive return even in years when two asset classes had horrible years, like in 1973 when stocks and bonds fell, or 2000 when stocks and gold both fell. Performance Since 2008 This was part of the PP appeal back in 2011 and 2012. The memory of the 2008-2009 crash was fresh in everyone’s minds. Real estate seemed toxic and gold was soaring. Income was getting harder to find, and everything seemed too risky. A lot of people wanted to invest, but were still terrified of the stock market. Low volatility and diversification were hot topics, and this made the Browne’s permanent portfolio come back into vogue: (click to enlarge) The chart above tracks Google searches for “permanent portfolio”, and the steady rise in 2010 to 2012, to breach spikes in searches during the 2008 crisis, is partly an indicator of just how enduring Browne’s idea is in times of fear. Those who searched back then were probably pleased with what they saw. The permanent portfolio steadily provided strong returns throughout the 90s and 2000s, and even seemed to weather the storm of 2008 , when talk of apocalypse graced the lips of the financial press: (click to enlarge) It’s no surprise, then, that many turned to the permanent portfolio, which had held steady returns largely thanks to gold and U.S. Treasuries during and immediately after the crash. Of course past performance is no indicator of future results, and those who have stayed with Browne have had some stressful times since then. The portfolio has massively underperformed stocks since 2012, and has actually lost about 15% from then to the present. To make matters even worse, Morningstar rates the Permanent Portfolio Fund (MUTF: PRPFX ) one star for its 3-year and 5-year returns, with low returns and high risk. Yet its 10-year rating is high return and above average risk with four stars. Clearly something changed in the last three years to obliterate Browne’s strategy. So what happened? Why Permanent Portfolio Doesn’t Work Anymore A quick glance at one chart shows the problem. Taking together an ETF portfolio following the PP philosophy, our basket will contain SHV, GLD, TLT, and SPY in equal amounts. Looking at these funds’ performance since 2007 tells us one thing: gold is the biggest contributor to our returns: (click to enlarge) Gold rose over 180% from start to peak, and has erased over 100 percentage points of gains since then. The fall has decelerated in recent months, but the slide in gold’s value has hit our PP severely, while both TLT and SPY provide us with much smaller, but much steadier returns since 2009. Why is gold underperforming? The primary reason is simple: a lack of inflation. If we look at the urban consumer price index (CPI-U) and the personal consumption expenditure index (PCE), which are the two biggest indices for measuring inflation used by economists both in and outside the Federal Reserve, we see an average annual inflation rate of 1.81% since 2007–far below the historic norm and below the Federal Reserve’s target: (click to enlarge) As Browne told us, low inflation means underperformance for gold. If we are in an era of secular stagnation, as Professor Larry Summers confidently tells us , then it is unlikely that we will see inflation rates rise considerably beyond that. But we also won’t necessarily see broad prosperity either, which should put pressure on stocks if quantitative easing and low yields do not drive more money into the stock market. Thus two of the four major components of the permanent portfolio are likely to drag down returns. If you disagree with Larry Summers, as Ben Bernanke famously did in a recent series of blog posts , that doesn’t mean you will necessarily benefit from the permanent portfolio either. The fact that the PP has underperformed in the last three years, providing YTD returns of -1.5%, 1 year returns of -7.6%, and 3-year annualized returns of 0.5%, tells us that the permanent portfolio is no longer permanent. It also tells us that something fundamental has changed in the world since 1982, and last generation’s sound investment advice is folly for this generation. Don’t Invest Your Politics One of Browne’s biggest appeals is his libertarian character. A former libertarian presidential nominee, the late Harry Browne wrote several books about the failure of government, the importance of self-reliance, and the importance of freedom (his most popular book is titled “How I Found Freedom in an Unfree World”). I suspect many permanent portfolio investors are likewise libertarians, who find sense in Browne’s message and thus think that will somehow translate to market-beating returns. The guilt by association fallacy here has been a costly one for investors over the last three years. Libertarian or no, investors who understand that politics and markets are separate things that may sometimes intersect have been able to avoid the allure of a permanent portfolio, and move their strategy with the market. Those who did so in 2012 and saw value in equities have beaten the Permanent Portfolio. So did those who bought high yield bonds, or those who went into real estate. Even those who bought U.S. Treasuries have done better than Browne’s followers. It is clear that the Permanent Portfolio is not so permanent anymore. For those looking for low volatility and steady appreciation, it is time to look elsewhere. Disclosure: I/we have no positions in any stocks mentioned, and no plans to initiate any positions within the next 72 hours. (More…) I wrote this article myself, and it expresses my own opinions. I am not receiving compensation for it (other than from Seeking Alpha). I have no business relationship with any company whose stock is mentioned in this article.