Tag Archives: pro

Upcoming Political Risks For TransCanada Corp And The Keystone XL Pipeline

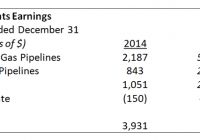
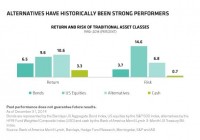
Summary Upcoming Canadian Federal Elections present significant risks for TransCanada Corp. The proposed Keystone XL and Energy East Pipeline projects will face strong headwinds if the NDP wins a minority. Expect increased short term volatility as these events unwind and the possible outcomes become more clear to investors. TransCanada Corporation (NYSE: TRP ) is a Canadian midstream oil and gas company operating in three main business segments: Natural Gas Pipelines, Liquids (crude) Pipelines and Energy. Its pipeline operations extend from Canada to the U.S and Mexico. Revenue breakdown for 2014 between these segments can be seen bellow: (click to enlarge) ( 2014 Annual Report ) TRP currently has two large proposed pipeline projects that have created a lot of public reaction recently and have become hot topic for the media and politicians from both the U.S and Canada. These projects are the Keystone XL and Energy East pipelines. With the Canadian Federal election to be held on October 19th, 2015, it is critical to evaluate each party’s stance on these two proposed projects. Keystone XL Pipeline Overview: The Keystone XL pipeline would transport crude oil for Alberta to Nebraska, expanding the current and operational Keystone Pipeline System. The proposed pipeline would measure 1,897 km long, possess a capacity of 830,000 barrels of oil per day and is estimated to cost $8 billion with $2.4 billion already invested. The pipeline faces a difficult regulatory environment. Since it crosses international borders between Canada and the United States, it is required to obtain a Presidential Permit from the Department of State. The Permit is awarded if the proposed Project serves the national interest, which is a very broad term and requires the consideration of many factors such as energy security, environmental, cultural and economic impacts. Energy East Pipeline Overview: The Energy East Pipeline would transport crude oil from Alberta and Saskatchewan to the eastern Canadian refineries as well as other export markets. In terms of length, this pipeline would span 4,600 km, have a capacity of 1.1 million barrels per day and is estimated to cost $12 billion. The regulatory environment for this project is administered by the NEB (National Energy Board) in Canada, which likely stands to approve the project providing the environmental requirements are met and political support remains. Upcoming Canadian Elections: The outcome of the upcoming Canadian Federal Elections slated for October 19th 2015 will have a significant impact on the likelihood of the Keystone XL and Energy East pipelines being completed. While both Harper’s Conservative party and Trudeau’s Liberals support both projects, the NDP led by Tom Mulcair is currently opposed. While the NDP has yet to win a federal election, this year may be its best chance yet. After a break through election in 2011 in which the NDP replaced the Liberals as the current opposition party. To add to the fact, the Alberta NDP recently won the Albertan provincial election, widely considered a Conservative stronghold and native land of Stephen Harper. The Tory’s have called an early election with the hopes of outspending their opponents. New rules introduced increase the spending limit for longer campaigns. The hope is that this will allow them to outspend the NDP and Liberals on advertising during the critical final weeks leading to the election. While still extremely early in the race, it is worth noting that the NDP currently holds a small but growing lead over the Tories. (click to enlarge) Source: CBC.ca . United States Political Front: As for the U.S political front, Obama has strongly opposed the Keystone XL project and it is extremely unlikely this position will change during the remainder of his term in office. TRP’s hopes lie with the next administration from which they can expect a better odds that they will receive support. Hillary Clinton recently refused to provide a direct answer to whether or not she supports the Project, stating that her current position and the potential for he involvement in a possible lawsuit prevents it. While she is unable to provide any comments at this time, her refusal to offer outright support for Obama on this issue signals that she may be more supportive of the project. As for the Republicans, Jeb Bush tweeted his support : “Keystone is a no-brainer. Moves us toward energy independence & creates jobs. President Obama must stop playing politics & sign the bill.” The economic benefits of the project throughout the U.S would make it difficult for any Republican candidate to oppose it. Conclusion: The impact of an NDP victory in the upcoming Canadian Federal Election presents a significant risk for TransCanada Corp. Two of TRP’s flagship pipeline projects, Keystone XL and Energy East, currently supported by the Tories, are strongly opposed by the NDP. While TRP appears to be a sound value play in the midstream O&G market, offering a juicy 4.31% yield and stable operating cash flows, the upcoming political risks should not be underestimated. Disclosure: I/we have no positions in any stocks mentioned, and no plans to initiate any positions within the next 72 hours. (More…) I wrote this article myself, and it expresses my own opinions. I am not receiving compensation for it (other than from Seeking Alpha). I have no business relationship with any company whose stock is mentioned in this article.

Large Cap Funds: Active Versus Passive

By Todd Rosenbluth In the first half of 2015, investors pulled $22 billion out of large-cap core U.S. equity mutual funds, but added $19 billion to S&P 500® Index-linked mutual funds. While this confirms that active management is losing share to passive, we think there are still strong active large-cap mutual funds to choose from. According to S&P Dow Jones Indices, just 23% of all large-cap core active funds outperformed the S&P 500 Index in the three-year period ended 2014 . (It is not possible to invest directly in an index, and index returns do not reflect expenses an investor would pay). On an equal-weighted basis, the average large-cap fund’s 18.6% three-year annualized return lagged the S&P 500 index by approximately 180 basis points. These performance challenges are not rare, as just twice in the past ten calendar years more than 50% of actively managed funds have beaten the “500”. A separate S&P Dow Jones study revealed how hard it is for those large-cap funds that outperformed to continue to do so. Indeed, just 4.5% of the outperformers in the 12-month period ended March 2011 maintained their top-half ranking in each of the four subsequent 12-month periods. The S&P Dow Jones Indices studies highlight that you would be better off with an index-based large-cap offering than choosing an average active fund. In fact there are many below-average performers. For example, the Davis New York Venture Fund (MUTF: NYVTX ) is among the biggest large-cap core funds, yet it lagged peers in four of the five last five calendar years. Indeed, NYVTX and its sister share classes had $2.8 billion of outflows in the first half of 2015. Of course, nobody aims to invest in a below-average mutual fund. S&P Capital IQ’s mutual fund rankings incorporate holdings-based analysis as well as a review of a fund’s relative track record and cost factors. We find 30 large-cap funds meet our criteria, though some of multiple share classes of the same portfolio. The list of funds included the American Century Equity Growth Fund (MUTF: BEQGX ), the Fidelity Fund (MUTF: FFIDX ), the T. Rowe Price Growth & Income Fund (MUTF: PRGIX ), and the Vanguard Growth & Income Fund (VNQPX). S&P Capital IQ hosted a client webinar on active versus passive strategies on Tuesday, August 4, but you can listen to a replay http://t.co/4KDPwLW9Aj . Reports on the aforementioned mutual funds and ETFs can be found on MarketScope Advisor. Disclosure: © S&P Dow Jones Indices LLC 2015. Indexology® [link “Indexology®” to http://www.indexologyblog.com/] is a trademark of S&P Dow Jones Indices LLC (SPDJI). S&P® is a trademark of Standard & Poor’s Financial Services LLC and Dow Jones® is a trademark of Dow Jones Trademark Holdings LLC, and those marks have been licensed to S&P DJI. This material is reproduced with the prior written consent of S&P DJI. For more information on S&P DJI and to see our full disclaimer, visit www.spdji.com/terms-of-use [make sure this appears hyperlinked].

Do Your Alternative Investments Have The Right Fit?

By Richard Brink, Christine Johnson Investors who chose alternatives for downside protection in recent years have been frustrated with their performance. We think the problems were an unfavorable market environment and the unique challenges of manager selection for alternatives. In May 2013, the market’s “taper tantrum” in reaction to announced changes in U.S. monetary policy pushed bond yields up; stocks stumbled briefly before continuing to pile up strong returns. For many investors, this heightened concerns about extended market valuations and an impending interest-rate increase. Taking a page from the typical playbook, many investors looked toward long/short equity strategies and nontraditional bonds as ways to protect against potential market downside. But in 2014, playing defense didn’t pay off: U.S. equity markets gained another 14% and bond yields fell. Long/short equity strategies, on average, returned 4%. That experience left many investors disappointed with alternatives-both equity-oriented and fixed income-oriented. It hardly came as a surprise when investors shifted money out of alternatives early in 2015, moving it into core fixed-income funds and international equities-mostly through passive exchange-traded funds (ETFs). The Long-Term Value of Alternatives We think investors were right in looking to alternatives for protection against potential downturns. Alternatives have provided better returns than stocks, bonds or cash over the past 25 or so years, with less than half the volatility of stocks ( Display ). And long-term data show that incorporating alternatives in a traditional portfolio may enhance returns and reduce risk. If that’s the case, what went wrong in 2014? We think the problem was twofold. First, a good portion of alternatives’ poor performance stemmed from the multiyear, largely uninterrupted bull-market run. This extended rally rendered the long-term benefit of “hedging” with alternatives somewhat moot. Second, many investors bought the right idea of alternatives: participation in all markets with downside protection. But in many cases, they didn’t buy the specific behavior in an alternative that was the best fit for their portfolio and risk/return preferences. It’s not an easy selection process. There are thousands of different alternative strategies to choose from and a lot of dispersion among managers within alternative categories. It’s not enough to simply buy a top performer from a seemingly relevant category. It’s critical to have specific characteristics in mind: Exactly how much downside protection do you want? And how much participation in up markets are you looking for? Once you know your objectives, you can start doing the homework to zero in on a strategy and manager that aligns with them. What’s in an Alternative Category? Everything One of the challenges to finding the right fit is that alternative categories have a lot more variety than their traditional equivalents. They just don’t provide as much help in narrowing down the decision. Take Morningstar indices. They have about 40 different categories for traditional, or long-only, equities. There are categories for different geographies, market capitalization ranges, styles and even sectors. For long/short equities, there’s only one category. If an investor wants to find the right long/short equity strategy, it takes a lot of legwork to uncover the one with the best fit. Without that, investors are at the mercy of manager dispersion. Three Levers That Create Manager Dispersion What creates such big dispersion among alternative managers? We think three levers are at play: style, market risk and approach. We talked about the first lever already: the traditional style buckets of geography, investment approach, market capitalization and industry/sector make for a lot of differences. The second lever is how much overall market risk and sensitivity a manager has-a lot or a little-and how much it varies depending on conditions. The third lever is the approach a manager uses to create the portfolio’s overall market exposure. For example, does the manager use cash, market hedges or short positions in individual stocks? What mix of these instruments does the manager use, and in what environments? All three elements and their combinations can vary to define your experience with a specific alternative manager’s approach. Conducting three-dimensional research to gain a clear understanding of the levers-and which settings are best for you-is the key to choosing the right alternative manager. And the need to make that choice is rather pressing today, in our view. There aren’t a lot of broad cheap areas in capital markets today, and we expect more modest returns and higher volatility ahead for both stocks and bonds. Relying on broad market returns alone isn’t likely to be as rewarding in the years to come, and alternatives can play a key role in enhancing a portfolio’s risk/return profile. The views expressed herein do not constitute research, investment advice or trade recommendations and do not necessarily represent the views of all AB portfolio-management teams.