Tag Archives: pro

Energy ETF PSCE Hits New All-Time Low

For investors looking for momentum, the PowerShares S&P SmallCap Energy Portfolio ETF (NASDAQ: PSCE ) is probably on their radar now. The fund just touched a new record low, and shares of PSCE are down roughly 61% from their 52-week high price of $49.57/share. But is more pain in store for this ETF? Let’s take a quick look at the fund and the near-term outlook on it to get a better idea on where it might be headed: PSCE in Focus PSCE focuses on the energy segment of the U.S. market, holding 33 stocks in its basket. It is a small cap-centric fund with key holdings in the energy equipment & services and exploration & production segments. The fund charges investors 29 basis points a year in fees, and has its top holdings in PDC Energy (NASDAQ: PDCE ), Exterran Holdings (NYSE: EXH ) and Carrizo Oil & Gas (NASDAQ: CRZO ) (see: all the Energy ETFs here ). Why the Move? The Energy sector has been an area to watch lately as oil price resumed its decline and got trapped in the nastiest downward spiral joining the broader sell-off in commodities amid growing global glut and the China slowdown. Additionally, the latest downbeat economic data from both the U.S. and China led to the concerns over tepid oil demand growth. More Pain Ahead? Currently, PSCE has a Zacks ETF Rank #4 (Sell), suggesting its continued underperformance in the coming months. Further, many of the segments that make up this ETF have the worst Zacks Industry Ranks. So there is still some downside risk signaling caution, and investors should wait until the sector bottoms out before jumping into this ETF. Original Post Share this article with a colleague

A Look At The Energy Sector Impact On Dividend ETFs

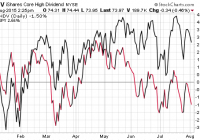
Summary While every index is slightly different, one theme that you often see repeated throughout the high dividend arena is an emphasis on big energy names. As a result of the energy sector woes over the last 12 months, I thought it prudent to look at the overall impact of these stocks on total return. One example of a fund with an outsized allocation to energy stocks is the iShares Core High Dividend ETF. One of the most popular strategies at our firm is the Strategic Income Portfolio, which focuses on a multi-asset approach to generate consistent income and overall low volatility. In order to accomplish those goals, we are continually scanning the ETF landscape to evaluate suitable equity income funds that meet our investment criteria. These ETFs typically consist of high-quality stocks with above-average dividend streams and low internal expenses. While every index is slightly different, one theme that you often see repeated throughout the high dividend arena is an emphasis on big energy names. Exxon Mobil (NYSE: XOM ) and/or Chevron Corp. (NYSE: CVX ) are commonly in the top 10 holdings of these diversified dividend portfolios. According to dividend.com, XOM has a current dividend yield of 3.74% while CVX yields 5.00%. As a result of the energy sector woes over the last 12 months, I thought it prudent to look at the overall impact of these stocks on total return. In addition, it should be noted that ETFs with a fundamental or dividend weighting methodology may be increasing their energy exposure in the future to adjust for the higher yields these companies are now paying. One example of a fund with an outsized allocation to energy stocks is the iShares Core High Dividend ETF (NYSEARCA: HDV ). This ETF is based on the Morningstar Dividend Yield Focus Index, which selects 75 stocks based on their high dividend yields and financial history. HDV currently has $4.3 billion in total assets, a 30-day SEC yield of 3.90%, and an expense ratio of 0.12%. The top holding in HDV is XOM, which makes up 8.3% of the total portfolio. Energy stocks as a whole are the second largest sector in HDV with a total weight of 18.45%. Obviously, this is going to result in these energy companies making a big impact on total return and overall yield. On a year-to-date basis, HDV is down 1.50% while the broad-based SPDR S&P 500 Trust ETF (NYSEARCA: SPY ) has gained 2.63%. This path of divergence really kicked into high gear over the last two months as the energy sector rolled over once again. While this overweight exposure has certainly been a drag on HDV, it hasn’t been a catastrophic event because of the counterbalancing effect of consumer staples and healthcare stocks. Other well-known dividend ETFs with a relatively healthy dose of energy exposure include: Vanguard High Dividend Yield ETF (NYSEARCA: VYM ) ~ 11.90% energy Schwab U.S. Dividend Equity ETF (NYSEARCA: SCHD ) ~ 11.40% energy WisdomTree Equity Income ETF (NYSEARCA: DHS ) ~ 13.55% energy First Trust Morningstar Dividend Leaders Index ETF (NYSEARCA: FDL ) ~ 10.62% energy Investors who believe the carnage in the oil & gas space is due for a bounce may be more inclined to choose a dividend ETF with a higher weighting in this sector. Conversely, those that are less enthusiastic about the prospects for an imminent recovery may choose to underweight or avoid these funds altogether. I continue to own VYM as a core equity income holding in my Strategic Income Portfolio. Despite its flat performance so far this year, the diversified basket of over 430 dividend-paying stocks offer attractive value characteristics and a dependable 30-day SEC yield of 3.26%. In addition, the ultra-low 0.10% expense ratio keeps the overall portfolio fees to a minimum. The Bottom Line One of the most important exercises that individual investors can do is analyze the index construction of their ETF holdings. Take note of any sectors that your funds are overweight or underweight in order to gauge how they will react under different circumstances. That way you are prepared in the event that a significant divergence occurs and can make adjustments as necessary. In addition, it’s important to reevaluate the portfolio on a quarterly or semi-annual basis. These funds undergo regular rebalancing and may shift their exposure based on the mandate of the index provider. Disclosure: I am/we are long VYM. (More…) I wrote this article myself, and it expresses my own opinions. I am not receiving compensation for it. I have no business relationship with any company whose stock is mentioned in this article. Additional disclosure: David Fabian, FMD Capital Management, and/or clients may hold positions in the ETFs and mutual funds mentioned above. The commentary does not constitute individualized investment advice. The opinions offered herein are not personalized recommendations to buy, sell, or hold securities.
Retail-Related Funds Rise On Higher Earnings From Core Holdings

Summary Despite weak retail sales forecasts, the Direxion Daily Retail Bull 3x ETF has risen on Amazon’s higher earnings like a drone for home delivery. The Fidelity Select Retailing Portfolio has also soared, on the back of strong retailers, and offers an unleveraged exposure to this sector. However, other ETFs in the retail sector, such as the XRT Retail SPDR is mired in a consolidation. A handful of retail stocks are the key to this out-performance. As key retailers get stronger can the market be far behind? Introduction: Lowered Retail Sales Forecasts The National Retail Federation recently lowered their forecast for the 2015 calendar year from +4.1 percent to +3.5 percent (see reference 1). They also lowered their back-to-school spending by as much as -9 percent (see reference 2). These lowered forecasts are seen in the performance of say the SPDR S&P Retail ETF (NYSEARCA: XRT ) , which is stuck in a trading range between approximately 96 and 102 (see Figure 1). (click to enlarge) Figure 1: The SPDR Retail ETF is stuck in trading range, consistent with lack luster retail sales forecasts. (Chart courtesy StockCharts.com) AMZN, PCLN Report Strong Earnings In the current earnings season, Amazon (NASDAQ: AMZN ) reported a quarterly EPS of $0.19 per share, versus a consensus of a loss of -$0.15 per share (reference 3), pushing sharply higher (see Figure 2). Then Priceline (NASDAQ: PCLN ) pushed to all time highs on its earnings report (see reference 4), coming it at $11.57 versus an expectation of $11.10. Clearly, some retailers have something up their sleeve. (click to enlarge) Figure 2: Amazon has soared on higher earnings (Chart courtesy StockCharts.com) (click to enlarge) Figure 3: Priceline pushed to all time highs on earnings (Chart courtesy StockCharts.com) Select Retailers Now Trending Strongly The markets have rewarded the improved earnings by pushing these stocks higher. Their relative out-performance can be measured using the table below (see Figure 4). The absolute medium-term trend strength of the Fidelity Select Retailing Portfolio ( FSRPX) and the Direxion Daily Retail Bullish 3x ETF ( RETL) put them in the top tier of all funds. They are much stronger than the broader S&P-500 index which is only at 52, and are soaring compared to the Apple (NASDAQ: AAPL ), the other retailing giant. (click to enlarge) Figure 4: The absolute trend strength of FSRPX and RETL puts them in the top tier. Note how they are much stronger than retailing giant AAPL, and the S&P-500 index itself. (Data courtesy ETFmeter.com) Leveraged and Un-leveraged Opportunities It is rare to find two such similar funds offering both leveraged and unleveraged investing opportunities into a particular sector with such near perfect correlation. The Fidelity Select Retail portfolio is unleveraged, and has good liquidity. RETL is leveraged, but has less liquidity. The leverage can cut both ways, should the market correct, and hence many might prefer the FSRTX to the RETL for further analysis. XRT is another unleveraged way to track the fortunes of retailers going into the fourth quarter with good liquidity and without the volatility that leverage can bring. Portfolio Weights Secret to RETL and FSRPX success RETL has a very large exposure to AMZN stock (see Figure 5 or reference 5). Almost 41% of the fund is in just three stocks. Even Home Depot (NYSE: HD ) is helping by breaking out to new highs. The portfolio for FSRPX is similar, though they do not give the same breakdown. About 67% of the FSRPX is in Home Depot, Amazon, Priceline, TJX companies (NYSE: TJX ) , O’Rielly Automotive (NASDAQ: ORLY ), G III (NASDAQ: GIII ), Lowes (NYSE: LOW ) and Ross Stores (NASDAQ: ROST ). So, the key to the success of these two funds is their portfolios (see Figure 6). A detailed comparison to other ETFs in the sector and other technical data are available at reference 6. Figure 5: The most recent portfolio weights for RETL (see reference 5) show a large position in Amazon, which has helped its performance. (click to enlarge) Figure 6: The returns of RETL and FSRPX have near perfect 0.99 correlation over the long-term. Thus, you can use the less leveraged option with similar approaches to this sector. (Chart courtesy StockCharts.com) Looking Ahead All retailers are clearly not the same. Some have harnessed technology to their competitive advantage. Traditionally, the last quarter of the year is the best quarter for retail earnings. So better days are ahead for the strongest retailers, as the economy picks up in the second half. Plus, this sector offers both unleveraged and leveraged funds to suite your comfort level. As key retailers strengthen, can the rest of the market be far behind? References National Retail Federation revises down 2015 US retail sales forecast Retail sales forecasts: Something doesn’t add up NASDAQ AMZN Earnings NASDAQ PCLN Earnings Direxion Investments ETFmeter Disclosure: I/we have no positions in any stocks mentioned, and no plans to initiate any positions within the next 72 hours. (More…) I wrote this article myself, and it expresses my own opinions. I am not receiving compensation for it. I have no business relationship with any company whose stock is mentioned in this article.