Tag Archives: pro

What Would Larry Tisch Do?

I am a long-time admirer of Larry Tisch, as well as a disciple of his investing principles, along with those of Warren Buffett. I was fortunate enough to have been invited many times to Larry’s “power breakfasts” at the Regency Hotel, where virtually everything in the news, and also not in the news, was discussed openly and freely. The debates were fierce, and everyone left the table a little bit smarter. Larry was an asset buyer, and loved to buy at fire-sale prices and then wait for a return to normalcy, at which time, he would sell. He also loved cash flow, and especially free cash flow, which is why the Loews (NYSE: L ) empire comprised hotels, tobacco, financial, real estate and CBS for a while. He was a contrarian thinker, out of the box, with a long-term outlook to create long-term value. I remember when he bought a fleet of tankers at liquidation value and sold them when shipping recovered. Gosh, I admired Larry Tisch. I emulate in many ways his investment principles. He taught me to be patient and keep your eye on the long term. He definitely bought low and sold high, and had the liquidity to wait it out. He did not measure himself in quarters, but in years. Sounds like Buffett, doesn’t it? Larry died in 2003, and I miss him and his breakfasts. Why do I bring up Larry at this time? I have mentioned the need to both have and monitor your core investing beliefs. While I consider myself an investor with a several-year time horizon, it is so easy to get sucked into the daily gyrations in the marketplace and marking to the market each day forcing us to question our beliefs. Those days are certainly not fun, but are worthwhile and teach a valuable lesson. Never get too comfortable and complacent. I do not consider myself a contrarian as Larry was, but I am a value buyer who has consistently made singles and doubles over 35 years with only a few setbacks. How else did I compound at over 18% over 35 years, with only 4 down years. I buy value, maintain my liquidity and am an investor rather than a trader. My portfolios tend to have very low turnover. Sounds like Buffett too, doesn’t it? By the way, why would Berkshire Hathaway ( BRK.A , BRK.B ) consider buying Precision Castparts (NYSE: PCP ) today? It’s an out-of-favor industrial whose earnings are depressed, has underperformed for three years and sells at 18 times current earnings. But Buffett sees it as a great value play having a good future with strong cash flow. By the way, this would be a standalone acquisition for Berkshire, so there are no merger synergies as in most mergers today. Sounds like a Tisch play! Mine, too. So what is the point of all of this? As I mentioned last week, the market has bifurcated, with perceived growth companies doing well, while industrial companies have languished a la Precision Castparts. I will come back to this point later, but you can sense where I am going. The key event of last week was clearly the employment numbers in the United States. There was a gain of 215,000 jobs in July, the unemployment rate stood at 5.3% (down from 6.2% a year ago), average earnings of workers were up 2.3% from a year earlier, and the broader measure of unemployment, which includes discouraged workers and part-time employees, fell to 10.2%. Since the Fed’s goal is 5-5.2% unemployment, the general consensus is that the first Fed rate increase is near. As I mentioned last week, the Fed is caught between a rock and a hard place, as it MUST maintain its credibility, so a rate increase is at hand, despite weakness overseas and a strong dollar. Do you really believe that an increase in the funds rate of 25 basis points from near zero will stop out the economy? No, and if the dollar increase dramatically more as foreign capital is sucked into the United States, our exports will only suffer more depressing growth. But the financial markets think differently, as the stock market fell on fears of the negative impact of a Fed hike on growth, and the yield curve flattened as the long end rallied. Something that we predicted would possibly occur after the Fed did raise rates even by a token amount. The U.S. economy continues to chug along at a 2.5%-plus rate led by the consumer, with inflation staying beneath 1.5%. By the way, did any of you go to the pump this weekend? I paid $2.80 a gallon. Consumer sales in the eurozone were weak in June, held down by fears of a Greek default and its potential negative impact. But I believe it that the slowdown is transitory and will pick up for the remainder of the year, bolstered by a strengthening economy led by exports and higher consumer disposable income benefiting from lower energy prices. German manufacturing orders have surged, and the country’s trade surplus will hit an all-time high this year. Germany is the clear winner of a weak euro. Maybe by design! China has continued to stumble along, at least compared to its historical growth rates. While the country’s Services sector has improved, with a reading of 53.8 last month, its exports have weakened more than anticipated due to lower demand from Europe, the United States and Japan. As I mentioned last week, I expect that the Chinese government will permit the yuan to weaken in order to bolster exports, and implement additional stimulus to boost domestic demand. Don’t cry for China, as growth in 2015 will still exceed my 6.5% growth target. The country reported that its inflation rate rose to 1.6%, so Bill Gross’ fears of deflation appear to be off the mark. The stock markets weakened every day last week, led by the industrials, and finally, some of the high-fliers like biotech. The pundits are clearly anticipating that a Fed rate hike will be the beginning of the end for our economy, so it’s time to honker down now and get defensive. Tisch would disagree, and Buffett, too, would clearly disagree, as he is putting his money where his mouth is in purchasing Precision Castparts – and I would disagree as well. I mentioned last week that I was beginning to cover many of my commodity shorts, excluding in the energy patch, as I began to see aggressive cuts in capital spending and a rationing in production to bring it in line with growth. Finally, the decline in many commodity prices has fallen beneath cash costs of production, which is a precursor for bankruptcies. All good for the well-capitalized, low-cost producers. Not only did I cover my shorts, but I went long BHP and RIO, which both have strong balance sheets, good cash flow and dividends over 5.5%, which are well-supported. Like Tisch, I am willing to wait for a return to normalcy in industrial commodity prices. I cannot say the same about energy, though, for many reasons which I have discussed over the year. Politics play a large role in continued over production of oil, and that won’t change with Iran likely to come on-stream. I started adding to my industrials, including chemicals, last week as they weakened as mentioned earlier. If Buffett could buy a Precision Castparts, I could add to General Electric (NYSE: GE ), Honeywell (NYSE: HON ) and United Technologies (NYSE: UTX ). There is tremendous value out there if you are patient. Find those companies making strategic changes to enhance their future prospects that are not fully recognized. There is so much to discuss with all of you that I have decided to begin a weekly webcast in September. It will create a forum, much like Tisch’s power breakfasts, where we can discuss the global events impacting investing and brainstorm on its implications. I will say more about this and some other things that could enhance our relationship in a beneficial way soon. I have enjoyed putting myself on the firing line week in and week out. I hope that you find it helpful too. The results are in after 18 months of writing weekly blogs, and I have been told that I batted over 750 during that period, which is way above the norm even for the most successful money managers whom I have been compared to, like Leon Cooperman. My funds under management during this period were up over 50% net of fees, including up 16% year-to-date averaging less than 92% net long. Next on my agenda is to build our relationship by maximizing my strengths in the area of your needs. The weekly webcast is the start. More to come. Remember to review all the facts, step back and take a deep pause to reflect, control risk at all times and… Invest Accordingly!
Total Stock Market ETF Showdown

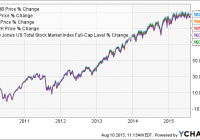
Summary A low expense total market ETF ought to be the cornerstone of a well-diversified portfolio. I will compare several well-known ETFs and ultimately make a recommendation. I will make a comparison on these metrics: expense, # of holdings, volume, yield, historical performance, and correlation. Introduction As a long term investor, I believe a low expense total stock market ETF should be a core holding in a diversified portfolio. Total stock market ETFs are designed to passively track the entire market by maintaining a large basket of small, mid, and large cap equities. These ETFs mitigate single stock risk and generally provide attractive dividends. Total stock market ETFs are invaluable for providing investors with exposure to strong equities within sectors they may not understand well. The best ETFs have low expense ratios (as to not siphon of long-term returns), and hold a well-weighted, liquid, basket of equities. ETF Contenders The Four ETFs I will compare are as follows: the Vanguard Total Stock Market ETF (NYSEARCA: VTI ), the Charles Schwab U.S. Broad Market ETF (NYSEARCA: SCHB ), the iShares Russell 3000 ETF (NYSEARCA: IWV ), and the SPDR Russell 3000 ETF (NYSEARCA: THRK ). Historical Correlation For an ETF like this, you want to see a long term correlation between the total market and historical returns. If this was a short term play (a leverage ETF, ETN, Ect.) I would go more in depth. In this case I graphed out 10 years of past performance (% change), and each ETF appears adequately correlated. SCHB and VTI appear to have the best total returns, and perhaps they are weighted the best (or most aggressively). Comparing Key Metrics Total Market – Key Metrics VTI SCHB IWV THRK Total Assets 56.22 Bil 4.99 Bil 6.24 Bil 248.92 Mil # of Holdings 3,814 2,018 3,008 2,509 P/E Ratio 21.7 X 19.3 X 19.97 X 17.70 X Avg. Volume 2.7 Mil 518,431 252,213 18,437 Expense 0.05% 0.04% 0.20% 0.10% SEC Yield 1.88% 1.81% 1.69% 1.77% Biggest Concern The aforementioned P/E ratios paint a larger picture of the overall market. The averaged out P/E multiple for the market is roughly 20X which indicates the market may be moving towards “overvalued” territory. I wrote previously that overall market returns average about 10% annually, but they also range from 5%-18% annually (averaged over a 20 year time frame). While returns over the last 5 years have been close to 12% annually, they may taper off to the lower range of historical returns. There could even be a short-term market correction. For this reason, I want to reiterate the importance of maintaining a long term horizon. Side note, it may soon become difficult to find opportunities for significant capital appreciation going forward. THRK The SPDR Russell 3000 ETF is the smallest of the four ETFs. THRK is not the cheapest, and it does not have as much liquidity as other options. Its small asset base is not optimal in comparison to relevant alternatives. THRK needs to grow to compete with iShares, Schwab, and Vanguard. IWV The iShares Russell 3000 has the highest expense ratio, but it does have some notable characteristics that differentiate it. IWV has unbiased exposure and large number of holdings. IWV additionally maintains a large percentage of small-cap stocks that gives it increased diversification and risk/reward. IWV’s low yield and low comparable liquidity, however, makes me believe their are better options. SCHB The Schwab U.S. Broad Market ETF is the cheapest option on the market (0.04%). It offers an attractive 1.81% SEC yield, but it excludes a number of micro-caps (decreasing reward and diversification benefits). It is very liquid, but not the most liquid, and SCHB holds the fewest equities of all four ETFs. VTI The Vanguard Total Stock Market ETF is the most traded of the four ETFs. VTI has the most AUM and a micro expense ratio (0.05% only 0.1% more than SCHB). Additionally, VTI holds the largest basket of equities giving it broad diversification and optimal market exposure. VTI currently has the highest SEC yield as well (1.88%). Recommendation I believe VTI and SCHB are the two best total market ETFs on the market. Of those two, I believe VTI is slightly better than SCHB because is provides more total market exposure and more liquidity. I would recommend a long position in VTI. I would also establish a dividend reinvestment plan (if possible) to increase the compounding effect over time. Disclosure: I/we have no positions in any stocks mentioned, and no plans to initiate any positions within the next 72 hours. (More…) I wrote this article myself, and it expresses my own opinions. I am not receiving compensation for it (other than from Seeking Alpha). I have no business relationship with any company whose stock is mentioned in this article.

An Update On 4 Tactical/Momentum ETFs

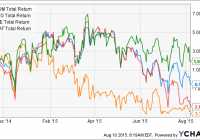
Summary Four tactical/momentum ETFs debuted in late 2014. These ETFs have the ability to switch between equities, bonds or other assets based on trailing momentum and/or volatility. How have these ETFs fared in the 9 months since inception? Introduction In a previous article , I discussed the debut of 4 tactical/momentum ETFs. Broadly speaking, these ETFs aim to exploit the momentum factor, which is often regarded as the premier anomaly due to its persistent outperformance over long periods of time. Stocks that have done well recently tend to continue to do well, while stocks that have done poorly recently tend to continue to do poorly. The momentum concept is embodied in aphorisms such as “Cut your losers and let your winners run.” Momentum works well not only within asset classes, but also between them. A momentum strategy that switches between stocks and bonds, for example (also known as “tactical” allocation), may well have allowed an investor to avoid the worst stock market crashes in history. A number of Seeking Alpha authors have presented various simple momentum strategies that have highly impressive backtested performance, such as varan , Frank Grossman and others. Recently, Left Banker described his own momentum strategy that had him reaping the rewards of treasury bonds in 2014. For investors who lack the time or inclination to implement their own tactical/momentum strategies, ETFs may be a valid alternative. Four such ETFs were launched in October or November of 2014. Cambria Global Momentum ETF (NYSEARCA: GMOM ) Global X JPMorgan US Sector Rotator Index ETF (NYSEARCA: SCTO ) Global X JPMorgan Efficiente Index ETF (NYSEARCA: EFFE ) Arrow DWA Tactical ETF (NASDAQ: DWAT ) For further details on the methodology of each of these ETFs, please see my previous article . Note that all four funds have the ability, at the minimum, to switch between equities and bonds. Hence, equity-only momentum funds, of which there are many, were excluded from this comparison. Given that it has been around 9 months since the debut of these four ETFs, I thought it would be a good time to assess their performance since their inception. Results The total return history of the four ETFs since the inception date of the newest fund (Nov. 2014) is shown below. GMOM Total Return Price data by YCharts The chart above shows that DWAT has had the highest total return of 1.94%, while SCTO has the lowest return of -3.33%. How does this compare with some of the most common benchmarks? The following 12 asset classes were selected as a comparison: U.S. equities (NYSEARCA: SPY ) Developed markets ex-U.S. equities (EAFE) Emerging market equities (NYSEARCA: EEM ) U.S. long-term treasuries (NYSEARCA: TLT ) U.S. intermediate-term treasuries (NYSEARCA: IEF ) U.S. investment grade bonds (NYSEARCA: LQD ) U.S. high-yield bonds (NYSEARCA: JNK ) Emerging market bonds (NYSEARCA: EMB ) U.S. real estate (NYSEARCA: VNQ ) Ex-U.S. real estate (NASDAQ: VNQI ) Commodities (NYSEARCA: DBC ) Global market portfolio (NYSEARCA: GAA ) The following bar chart shows the total return performances of the four tactical/momentum ETFs plus the 12 asset classes since Nov. 2014. The tactical/momentum ETFs are shown in green, equities in blue, bonds in red and other asset classes in yellow. We can see from the chart above that there has been quite a wide dispersion of return performances, with the highest being TLT at 6.35% and the lowest being DBC at -30.2%. The following chart is the same as that above except with DBC removed, in order to make the differences between the other funds easier to visualize. Discussion At first glance, it seems that the four tactical/momentum ETFs underperformed. U.S. stocks, as represented by SPY, returned 5.35% over the past 9 months, while the four U.S. bond ETFs averaged 1.57%. In contrast, the four tactical/momentum ETFs averaged only -1.19%. However, as Seeking Alpha author GestaltU has convincingly argued , a 60/40 U.S. stock/bond mix is not an appropriate benchmark for global tactical asset allocation [GTAA] strategies. Instead, the benchmark should be the investible global market portfolio [GMP]. This portfolio is nicely represented by the Cambria Global Asset Allocation ETF, ticker symbol GAA, which is the last asset class data point shown in the charts above. GAA returned -1.02% over the past nine months. This suggests that the four tactical/momentum ETFs did not significantly underperform this benchmark over the past nine months. Conclusions This article provides an update to four tactical/momentum ETFs that were launched around nine months ago. With domestic equities continuing to grind higher, many investors have been considering reducing their exposure to this space. For investors uncomfortable with market timing (like myself), the use of a tactical/momentum fund may allow investors to, in an ostensibly “passive” manner, stay invested in the outperforming markets such as the U.S. until the tide turns. However, this study also revealed a drawback of the tactical/momentum funds. None of these ETFs were apparently able to capture the full, or even any, upside of the domestic equity market (+5.35%) over the past nine months; in fact, as a group, the four ETFs exhibited a negative total return of -1.19%. This is especially surprising for SCTO (-3.33%), which invests only in U.S. sectors and/or U.S. short-term treasuries, and nothing else. Thus, investors should not expect the tactical ETFs to keep pace with the U.S. bull market, if it continues. Disclosure: I am/we are long GMOM. (More…) I wrote this article myself, and it expresses my own opinions. I am not receiving compensation for it (other than from Seeking Alpha). I have no business relationship with any company whose stock is mentioned in this article.