Tag Archives: pro

Lipper Closed-End Fund Summary: October 2015

By Tom Roseen For the first month in seven equity and fixed income CEFs posted plus-side performance on average on both a NAV basis (+5.97% and +1.07%, respectively for October) and market basis (+7.50% and +3.41%). Year to date equity CEFs remained in the red for the fourth straight month, down 4.41%, while fixed income CEFs moved more solidly into the black, returning 1.54% on average on a NAV basis for the same period. For the month many of the major broad-based indices chalked up their best one-month return since October 2011, with the Dow Jones Industrial Average Price Only Index and the S&P 500 Composite Price Only Index returning 8.47% and 8.30%, respectively. Beleaguered Shanghai Price Only Composite and Xetra DAX posted a couple of the strongest returns in the global markets, returning 11.50% and 11.15%, respectively, for October as investors cheered easy-money news from both the Peoples Bank of China (PBOC) and the European Central Bank (ECB). Despite a weaker-than-expected jobs report at the beginning of the month, mixed economic data throughout the month, and a roller-coaster ride of corporate earnings reports, volatility-as measured by the CBOE Volatility Index (VIX)-fell 38% over the month to 15, remaining below the long-term average of 20. Investors appeared to shrug off a disappointing nonfarm payrolls report that showed the U.S. had added a lower-than-expected 142,000 jobs for September-below the consensus-expected 200,000-as investors perhaps realized the Federal Open Market Committee was probably not going to raise interest rates this year. As commodity prices rallied mid-month, the S&P 500 posted is strongest weekly gain for 2015. And while the Fed minutes’ discussing global risks kept the hawks in check, many felt the downside risk was on the mend. Ignoring a slight decline in industrial production for September, consumer sentiment rose in October for the first month in four. A surprise cut in interest rates by the PBOC, better-than expected earnings reports from a few heavyweight tech firms (Amazon (NASDAQ: AMZN ), Microsoft (NASDAQ: MSFT ), and Alphabet (NASDAQ: GOOG )), and hints from the ECB that further easing might be in the cards pushed stocks to a fourth consecutive week of plus-side performance and sent investors into risker assets for the month and out of some recently popular safe-haven plays. Battered energy stocks got a shot in the arm with the rise in commodity prices and on news the central bank in the second largest economy in the world had cut interest rates, sending Lipper’s domestic equity CEFs macro-group (+6.48%) to the top of the equity CEFs universe for the first month since August 2014. World equity CEFs (+5.46%) and mixed-asset CEFs (+5.03%) also fared well during the month. Treasury yields rose at all maturity levels along the curve after the Fed left the door open for possible rate increases later this year, with the largest increase witnessed in the six-month yield and the five-year yield, 15 bps each to 0.23% and 1.52%, respectively. For the first month in four all three fixed income CEF macro-groups posted plus-side returns, with world bond CEFs (+3.29%) leading the way, followed by domestic taxable bond CEFs (+1.19%) and municipal bond CEFs (+0.68%) as investors put some risk back in their portfolios. For October the median discount of all CEFs narrowed 157 bps to 9.58%-slightly worse than the 12-month moving average discount (9.50%). Equity CEFs’ median discount narrowed 91 bps to 11.29%, while fixed income CEFs’ median discount narrowed 160 bps to 8.41%. For the month 82% of all funds’ discounts or premiums improved, while 16% worsened.
Tilts – Searching For (Relative) Value

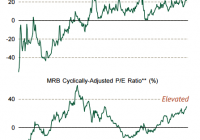
By Douglas R Terry, CFA The investing environment remains challenging. Equity valuations are high after a 6-year extraordinary bull market. Bonds have been in a bull market for 35 years, and yields, though off their 2012 lows, remain at historic extremes. After a 7-year, 700% bull in oil from 2001 to 2008, it gave back 90% of gains in 6 months. Oil followed this up with a 5-year bull, and again gave back 90% of gains in 6 months. Sometimes, as investors, it’s necessary to just invest in the best place possible, given a lot of historically poor choices. In these times of poor valuations, we want to stay underinvested, as embedded risk is higher than normal. We want to be nimble and try to avoid getting steam-rolled in markets that can drop 80% or more in less than 6 months. Here are some places I think we can find relative value. Equities: US equities have seen the best regional equity performance performance, but also have the highest valuations. US valuations relative to non-US stocks are at extremely high levels relative to the past 25 years. The US is performing better today than the rest of the world. Perhaps US strength can help the rest of the globe. A tilt toward Global Ex-US stocks has a good relative chance of providing portfolio value. Fixed Income: With rates at historic lows and the Fed contemplating a rise off the zero bound, one would want to be very careful in bonds. If you do venture out the yield curve, consider inflation-protected bonds. Oil has plunged over 60%, and much of the headline inflation weakness is tied to this major commodity. Perhaps, more importantly, much of the embedded future inflation expectations have dropped coincident with oil markets. If this recent soft patch is just a lull, which I believe it is, then interest rates may rise and bond portfolios would not perform well. But if the economy does prove resilient, oil may have found a bottom. Higher oil means higher inflation expectations. Stable oil means headline inflation creeps up toward core inflation. Both scenarios would be relatively good for inflation-protected bonds. In bond portfolios, consider upping the allocation to TIPs versus nominal bonds to use rising inflation expectations as a hedge against the potential of good growth and rising rates.

Investor Interest In Alternative Strategies Mutual Funds Wanes

By Patrick Keon After peaking in 2013 with net inflows of over $75 billion for the year, interest in funds in Lipper’s alternative strategies suite of classifications dipped; flows were relatively flat for 2014 (+$370 million) and have fallen into the red for 2015 year to date (-$16.6 billion). Lipper defines alternative strategy funds as portfolios that generate correlation benefits to traditional, long-only-constructed funds, as well as portfolios that implement a hedge fund-like strategy, often incorporating one or a combination of the following: leverage, derivatives, short positions, and/or multiple asset classes. Net inflows for the group for 2013 grew dramatically higher than the fund-flow results from 2012 (+$12.2 billion) and 2011 (+$6.7 billion). Almost all the net new money taken in by Alts for 2013 came from funds in just three classifications: Absolute Return Funds (+$38.1 billion), Alternative Long/Short Equity Funds (+$19.7 billion), and Alternative Credit-Focus Funds (+$15.0 billion). Leading the Absolute Return group was Wells Fargo Advantage Absolute Return Fund (MUTF: WARDX ) (+$5.5 billion) and John Hancock Funds II Global Absolute Return Strategies Fund (MUTF: JHAIX ) (+$2.7 billion). All three of these groups also posted positive numbers for 2014: Alternative Credit-Focus Funds (+$15.4 billion) once again recorded strong net inflows, but the results from Absolute Return Funds (+$4.2 billion) and Alternative Long/Short Equity Funds (+$8.2 billion) were more muted. The category that weighed down the overall flows results for Alt funds for 2014 and year to date 2015 has been the Alternative Global Macro group. Global macro funds saw over $32 billion leave their coffers last year and have had $16.7 billion of net outflows so far this year. PIMCO Unconstrained Bond Fund (-$19.9 billion) was the largest contributor to the negative flows from global macro funds, aided by PIMCO All Asset All Authority Fund (MUTF: PUBFX ) (-$14.6 billion) and MainStay Marketfield Fund (MUTF: MFPDX ) (-$13.1 billion). (click to enlarge)