Tag Archives: price

3 Low Beta ETFs For A Choppy Market

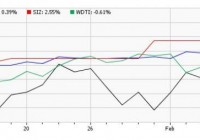
The U.S. stock market is caught in a web of uncertainty since the start of this year and sees little chance of it clearing up in the months ahead. This is primarily thanks to geopolitical tensions, sliding oil prices, turmoil in Greece, sluggish European and Japanese growth, weakness in key emerging markets, and weak corporate earnings. Additionally, the currency war has escalated with many countries choosing loose monetary policies to stimulate growth and prevent deflationary pressure. This is in contrast to the U.S. Fed policy of tightening the stimulus. The diverging central bank policies have propelled the U.S. dollar against the basket of various currencies to multi-year highs. Further, both the World Bank and International Monetary Fund (IMF) recently cut their growth forecast for the next two years. The World Bank projects the global economy to expand 3% this year and 3.3% in the next, down from 3.4% and 3.5%, respectively. On the other hand, IMF lowered its global growth outlook to 3.5% from 3.8% for 2015, representing the sharpest cut in three years. Growth for 2016 is forecast at 3.7% versus the previous projection of 4%. Another reason for the recent market pullback has been the U.S. monetary policy, wherein the Fed is on track to raise interest rates but the timing is still uncertain. Amid these uncertainties, investors are seeking exposure to alternative sources of income rather than equity and bonds. For these investors, an allocation to low beta funds could be the safest bet, as long as the disorder lingers. Why Low Beta? Beta measures the price volatility of the stocks or funds relative to the overall market. It has a direct relationship to the market movements. A beta of 1 indicates that the price of the stock or fund tends to move with the broader market. A beta of more than 1 indicates that the price tends to move higher than the broader market and is extremely volatile while a beta of less than 1 indicates that the price of the stock or fund is less volatile than the market. With that being said, low beta ETFs exhibit greater levels of stability than their market sensitive counterparts and will usually lose less when the market is crumbling. Though these have lesser risks and lower returns, the funds are considered safe and resilient amid uncertainty. However, when markets soar, these low beta funds experience lesser gains than the broader market counterparts and thus, lag their peers. Given the huge levels of volatility in the market, investors could find the following ETFs as intriguing options until the market track becomes clear. WisdomTree Managed Futures Strategy ETF (NYSEARCA: WDTI ): Beta – 0.02 This actively managed fund seeks to deliver positive returns in rising or falling markets that are uncorrelated to equity or fixed income returns. It uses a quantitative, rules-based strategy to provide returns that correspond to the performance of the Diversified Trends Indicator and invests in a combination of U.S. treasury futures, currency futures, commodity futures, commodity swaps, U.S. government and money market securities. This strategy seeks to benefit from both rising or declining price trends via long and short positions in commodity, currency, and U.S. treasury futures market. The product has amassed $209.9 million in asset base and trades in a light volume of about 34,000 shares a day. Expense ratio came in at 0.95%. The fund has added 0.3% so far in the year. QuantShares U.S. Market Neutral Size ETF (NYSEARCA: SIZ ): Beta – 0.14 This fund invests in low capitalization securities while at the same time short high capitalization stocks of approximately equal dollar amounts within each sector. It seeks to deliver the spread return between high and low ranked stocks. This can easily be done by tracking the Dow Jones U.S. Thematic Market Neutral Size Index. The product holds a long position in 200 stocks and a short position in another basket of 201 stocks. It will generate positive returns when the basket of long stocks outperforms the short portfolio. The fund is expensive charging 1.49% in fees per year and trades in a paltry volume of under 1,000 shares per day. BTAL is unpopular having AUM of $1.2 million and has added 0.9% so far this year. IQ Hedge Market Neutral ETF (NYSEARCA: QMN ): Beta – 0.19 This product tracks the IQ Hedge Market Neutral Index, which seeks to replicate the risk-adjusted return characteristics of hedge funds using a market neutral hedge fund strategy. It invests in both long and short positions in asset classes while minimizing exposure to systematic risk. This strategy seeks to have a zero beta exposure to one or more systematic risk factors including the overall market (as represented by the S&P 500 Index), economic sectors or industries, market cap, region and country. The portfolio consists of a variety of ETFs including a number of fixed income funds and equity funds. The ETF allocates heavy weights in fixed income products like the Vanguard Short-Term Bond ETF (NYSEARCA: BSV ), the iShares 1-3 Year Treasury Bond ETF (NYSEARCA: SHY ) and the Vanguard Total Bond Market ETF (NYSEARCA: BND ) focusing on Treasury and corporate securities that are of high quality. The ETF is often overlooked by investors in the hedge fund space with AUM of just $15.3 million and average daily volume of about 3.000 shares. It charges 85 bps in fees and expenses and is up 0.2% in the year-to-date timeframe. Bottom Line These products could be worthwhile for low risk tolerance investors and have the potential to outperform the broad market, especially if market uncertainty persists over the coming months.
Higher Rates And Improved U.S. Labor Market Hold Back SLV

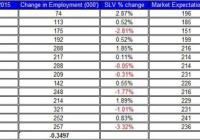
The price of SLV declined by 9% since its high a few weeks back. The recent Non-farm payroll passed expectations and coincided with the decline of SLV. The markets have revised up their expectations for a rate hike in mid-2015. The latest non-farm payroll report showed a better-than-expected result of 257,000 jobs gain in January – the market expectations were at 236,000. This news contributed to the latest fall in iShares Silver Trust ETF (NYSEARCA: SLV ), which lost 3.3% on Friday and nearly 9% from its high back in January 22nd. Here are the latest developments in the U.S. economy and its relation to the progress of SLV. The table below shows the relation between the changes in the non-farm payroll and the price of SLV in the past few reports. This time, the non-farm payroll came well above market expectations, which has led to a fall in the price of SLV. Another positive result was the revisions for December and November, which, combined, reached 147,000 more jobs than previously estimated. (click to enlarge) Source of data taken from Bureau of Labor Statistics The latest U.S. labor report also showed a higher-than-previously seen gain in wages – a 2.2% rise in hourly wages, which is the biggest gain since November 2008. This could be one of the main indicators that the FOMC has been looking for in determining its next move. If the recent rise in wages will put them on a higher path for growth, this could suggest the policy the FOMC has been implementing in recent years could come to an end within a few months. These recent positive results on both the number of jobs and gain in wages could bring the FOMC one step closer towards raising rates, which could, at the very least, curb down the rally of SLV. U.S. treasury yields have started to pick up again, which tends to move in the opposite direction to SLV; i.e. when yields rise, the price of SLV tends to decline. This was the case in recent weeks. Moreover, based on the latest update by the CME , the probability of a rate hike in the June meeting has increased to 27% – a month ago this probability was around 17.4%. For the July meeting, the probabilities are even higher at 50% compared to 37% a month back. So not for nothing, the market has also revised up its expectations for mid-year rate hike. But the ongoing economic slowdown and economic uncertainty in Europe could bring back down U.S. treasury yields. If yields were to resume their descent, as they did earlier this year, this trend could start pressuring back up SLV. In the meantime, the developments in Europe including the QE program and the tensions between the Greeks and the Germans over policy is likely to bring further down the Euro against leading currencies including the US dollar. Moreover, the recent decisions of Bank of Canada and Reserve Bank of Australia to reduce their cash rates are only bringing up the U.S. dollar. The ongoing recovery of the U.S. dollar against major currencies could start to adversely impact the price of SLV, albeit in recent weeks the correlations among major currency pairs and SLV were relatively weak, as indicated in the chart below. Source of data taken from Bloomberg The silver lining for silver bugs is that the strengthening of the U.S. dollar could also, down the line, start to weigh on the progress of the U.S. economy and taper down its growth. After all, a stronger dollar may reduce the competitive edge of U.S. exports, increase trade deficit and cut imported inflation. Therefore, if this trend persists, it may eventually start to have an adverse impact on the U.S. economic recovery, which could benefit SLV investors. The silver market isn’t an investment for the faint of heart, which is characterized with high volatility. The ongoing recovery in the U.S. economy is likely to keep pushing down the price of SLV. But from the other side, the global economic mess we face, especially in Europe, could bring down U.S. treasury yields and thus also increase the demand for precious metals. These two opposing forces are likely to keep SLV zigzagging in the near term. For more see: Is SLV about to change course? Disclosure: The author has no positions in any stocks mentioned, and no plans to initiate any positions within the next 72 hours. (More…) The author wrote this article themselves, and it expresses their own opinions. The author is not receiving compensation for it (other than from Seeking Alpha). The author has no business relationship with any company whose stock is mentioned in this article.

American Electric Earns Bullish Thesis With Its Solid Growth Prospects

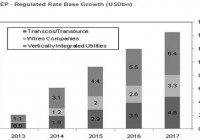
Summary Company making correct decisions to grow regulated operations. Regulated operations will provide sales, earnings and dividend stability. Aggressive capital expenditures will fuel AEP’s earnings growth in future. I reiterate my bullish thesis on American Electric Power (NYSE: AEP ); the company’s strategic growth plan focused on broadening and improving its regulated asset base will help it better its sales and attain a sustainable cash flow base through a decent increase in its rate base. As part of its long-term growth plan, the company is working to improve its competitive business results, and it will be making aggressive investments in transmission operations, which will portend well for both AEP’s top-line and bottom-line numbers. As regulated operations will gather more cash flow stability for the company, AEP will continue to reward its shareholders through dividends. Moreover, the company’s cost saving plan will positively affect its bottom-line numbers. The stock offers a potential price appreciation of 8.3%, as per my price target calculations, shown below. AEP Making Right Moves to Excel in Long Term 2014 was a good year for AEP; the stock is up approximately 35% in the last 12 months. The company’s performance has been positively affected by the low yield environment and improving demand from industrial and consumer segments. The company’s increased dependence on regulated operations has been helping it exploit the industry’s growth prospects. AEP’s strategic growth formula is centered on generating sales growth through increased capital expenditures for the infrastructure development of transmission business. The company has laid out its plan to make an investment of around $4.8 billion towards the betterment of its transmission business over the next three years. Owing to its large scale capital expenditure plan for regulated operations, especially for the transmission business, I believe the company’s regulated rate base will grow at a decent pace, delivering significant upside to its top-line numbers. The following chart shows AEP’s expected regulated rate base growth for upcoming years. Source: Power&RenewableInsights.com Along with the transmission infrastructure growth expenditures, the company is also looking at all possible options to better the results of its competitive business. AEP has made an announcement that Goldman Sachs will assist in improving and exploring the options of its competitive business operations. As utility companies like Duke Energy (NYSE: DUK ) are shedding their competitive operations , I believe AEP will also consider the option of selling its competitive energy assets to address the prevailing challenges and increase its focus on regulated asset base. Moreover, if the company opts to sell its competitive operations, the sales proceeds of competitive assets could be approximately $2.8-$3.6 billion . In addition, AEP has been actively pursuing its cost reduction plan, the “lean deployment” plan, to reduce its expense burden and support its future profitability. The plan has been rolled out to 13 distribution districts and 13 more districts are under review in order to deliver the management’s anticipated cost savings of $100-$200 million from the lean deployment plan by the end of 2016. In fact, the cost saving plan will grow the company’s bottom-line trajectory and will add towards its EPS growth. AEP have reiterated its earnings guidance for 2015 in its recent 4Q14 earnings conference call; the company expects its earnings to grow in a range of $3.40-$3.60 per share. Owing to its ramped up efforts to grow regulated rate base and healthy cost saving initiatives, I believe AEP will be able to grow its earnings at a decent base. Analysts are also anticipating that the company will deliver a healthy next five-year earnings growth rate of approximately 4.92% . Financial Performance The company recently reported 4Q’14 operating EPS of $0.48 , down from $0.60 per share in 4Q’13. The company’s quarterly earnings were negatively affected by its plan to speed up its capital expenditures and shift its O&M expenditures from 2015 and 2016, to 2014. The company’s decision to shift the future expenses to 2014, have improved earnings visibility and will positively affect its future earnings growth rate. Despite soft earnings for 4Q’14, the company reported an operating EPS of $3.43 for full year 2014, up 6% year-on-year. Investors Remain Rewarded AEP has a strong history of rewarding its shareholders through healthy dividends. The stock currently offers a safe dividend yield of 3.35% . The company’s healthy cash flow base has been supporting its hefty dividend payments and its current payout ratio of 55% indicates that AEP can increase its payout ratio to increase dividends in upcoming years. Keeping track of its impressive dividend payment policy, the company recently announced a quarterly dividend payment of 53 cents , an increase of 6%, year-over-year. Owing to AEP’s increased focus on regulated operations, I believe the company will attain more cash flow stability in the years ahead, ensuring the stability and security of its long-term dividend payment plan. The following table shows the dividend per share and dividend payout of AEP from 2012-2014, and includes figures for 2015, based on my estimates. 2012 2013 2014 2015(NYSE: E ) Dividend Per Share (In-$) $1.88 $1.95 $2.02 $2.10 Dividend Payout Ratio (In-%) 61% 60% 57% 61% Source: Company’s Yearly Earnings Reports & Equity Watch Estimates Risks Despite the company’s sturdy growth efforts, strict environmental regulations from authorities will remain an overhang on its future stock price performance. Since AEP has been making huge investments to develop its transmission infrastructure, I believe future capital expenditures could weigh on its cash flows. Price Target I have calculated a price target of $69 for AEP through a dividend discount model. In my price target calculations, I have used cost of equity of 6% and nominal growth rate of 3%. The stock offers an upside price potential of approximately 8.3%, as per my price target calculations, shown below. 2015 2016 2017 Terminal Value Dividend Per Share (In-$) 2.10 2.12 2.20 75.53 Present Value of Dividend Per Share (In-$) 1.98 1.88 1.85 63.45 Source: Equity Watch Calculations & Estimates Total Present Value of Dividend per Share = Price Target = $1.98 + $1.88 + $1.85 + $63.45 = $69/share Conclusion The company has been delivering a healthy financial performance in the recent past. The company has been making the correct decisions to grow its regulated operations, which will improve its financial performance. Also, regulated operations will provide sales, earnings and dividend stability. The company’s aggressive capital expenditures will fuel its earnings growth in the future. The stock offers a safe dividend yield of 3.35%, which makes it a good investment option for dividend-seeking investors. The stock also offers a potential price appreciation of 8.3%, based on my price target. Due to the aforementioned factors, I am bullish on AEP. Disclosure: The author has no positions in any stocks mentioned, and no plans to initiate any positions within the next 72 hours. (More…) The author wrote this article themselves, and it expresses their own opinions. The author is not receiving compensation for it (other than from Seeking Alpha). The author has no business relationship with any company whose stock is mentioned in this article.