Tag Archives: price

Union Pacific: How To Trade Around A Core Position

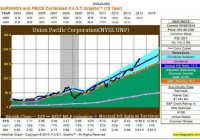
Summary After researching and developing a clear investment thesis, I designated Union Pacific a “core” equity position. Disciplined trading around core positions permits an investor to harvest gains, then buy back shares during routine over/undervaluation cycles. Here’s a step-by-step “How To Do It” featuring Union Pacific stock; including concepts, specific process, and results. Union Pacific Corp. (NYSE: UNP ) is a core position in my portfolio. Here’s my definition of a core position : An investment security identified as a foundation holding; a position the portfolio owner believes meets fully his/her investment philosophy and objectives. The owner expects the investment thesis to be strong, long-term, and durable. Notably, even if a core position, I own no “buy and hold forever” stocks. I scale in and scale out of equity positions; accumulating shares when prices appear discounted, and distributing shares when prices are deemed expensive. Typically, a core position “base” remains in my portfolio for years. The accumulation/distribution process usually takes months. As an example, we will use Union Pacific common stock. UP is America’s largest Class I railroad, effectively covering the western two-thirds of the country. In addition, the company has six gateway interchanges with Mexico, and a busy west coast marine/rail intermodal business. Union Pacific Investment Thesis About 2 years ago, Seeking Alpha editors published my initial article about Union Pacific . I outlined an investment thesis, then reinforced it in a subsequent article . That thesis is outlined below: The railroad business is an oligopoly, or a “large moat” enterprise. Carriers enjoy good returns on capital, generate profits in cash, and have strong franchises…and thus enjoy a level of pricing freedom. Based upon multiple operational and financial measures, I believe Union Pacific is the best-of-breed U.S.-based railroad. Its balance sheet is the strongest in the industry. The company operates primarily throughout the western two-thirds of the United States, offering superior span, scale, and future growth. Multiple west-coast and Mexican interchanges provide unique international opportunities. Union Pacific has experienced strong revenue growth via transportation of automobiles, industrial products, and chemicals. Historically, such freight lines do well in an expanding economy. UP expects these segments to continue to drive strong volumes and revenues. Coal volumes remain a concern for all major rail carriers. After a difficult 2013, coal shipments stabilized in 2014. In addition, UP has a heavy tilt to “oil” versus “coal.” While the long-term trend for U.S. coal consumption is at best uncertain, the trend for crude oil and related drilling materials (pipe, frac sand, etc.) is expected to be positive. UNP management is shareholder-friendly. The 5-year dividend growth rate is 27%. Since the end of 2006, share repurchase plans have reduced the number of diluted shares outstanding by more than 18%. The Initial Accumulation Phase Having developed an investment thesis, backed by fundamental due diligence, it was time to buy the stock. Here is an outline of my original UNP purchases. I bought shares in 3 transactions, beginning in early 2013. For illustrative purposes, I’ve denoted share quantities proportionally to round a sum total of “100” shares. Purchase prices are actual: Bought 40 shares @ $150 Bought 40 shares @ $153 Bought 20 shares @ $163 These 3 purchase events were spaced over 6 months. While I prefer to buy at lower and lower prices (yes, folks, I hope a stock goes DOWN after I begin to buy it), this time corporate performance and prices didn’t cooperate. I bought shares, waited, bought some more at just a little higher price, then waited several months before combining 2 related decisions: I thought it time to fill out the “100” share position I believed the stock was still trading significantly below fair value Note the last purchase was for a lesser amount of shares than the first two purchases. If the stock price had gone DOWN, instead of up, I would have bought even more shares. A Time to Wait Patiently After accumulating a “full” UNP position, I waited. Waiting isn’t idle time. All the while I monitored the investment and “did the homework.” This included reading and reviewing routine news releases, earnings reports, earnings conference call presentations/transcripts, investor presentations, and the SEC filings. Pleasantly, Union Pacific shares trended upward. By June 2014, prices topped $200 a share. I was faced with a high-grade problem: I deemed the shares overvalued. The Distribution Phase In June 2014, SA published another article I wrote about Union Pacific entitled, ” Premier Companies, But Overpriced Stocks – Part 1. ” At the time, I viewed UNP common shares to be trading too rich. Among the evidence, I offered the following F.A.S.T. graph: (click to enlarge) Notice how the black line (price) had become far upfield from operating earnings (the green shaded area). Shares were trading above expected full-year 2014 EPS and the year wasn’t half over yet. Note: In mid-2014, Union Pacific’s stock split 2-for-1. Post-split, I owned “200” shares each worth about ~$100. So, as aligned with my article, I began lightening up shares in June. Selling “40” post-split shares represented 20% of my original “100” share holding. The stock had appreciated ~38% from my first purchase. General Rule #1: When a stock is up more than 25%, sell about 25% of the original holding. “But Ray,” you may ask, “The stock was up more than 25% and you sold less than 25%! You didn’t follow your own rule!” Yes, you are correct. Indeed, I didn’t think the shares were overvalued until cracking $100; and when they breached that mark, the stock was running. Postponing the sale was buttressed additional rationale: the 1Q 2014 earnings report/forward guidance/ongoing fundamentals were outstanding, the technical charts were strong, and I tossed in a dash of intuition. Therein lies the beauty of being an Individual Investor . I don’t have to answer to anyone except myself. Yes, I have investment rules. But I can bend the rules. As an Individual Investor , I have the right to be delightfully inconsistent. After I sold shares at $104, I felt reasonably confident the price would hit a wall. I was wrong. The shares kept running up. So here’s another “rule” for consideration: General Rule #2: Never accumulate or distribute shares all at once, no matter how certain you are. Scale in and scale out in increments. To do otherwise is arrogant. While I bent my first rule, following the second one resulted in a lot of additional gains. Between June and the end of the year, I sold down as the stock went up: Sold 20 shares @ $121, and finally sold 40 shares @ 119. By the end of 2014, I had offloaded half my total UNP shares. Since Union Pacific was a core position, my plans were to sell not more than 50% of the original holding. I had a nice profit from the shares sold. Now it was time to wait again. Historically, the stock should revert to the mean and “come in” again; at such time, I would attempt to regain my old “100” share position. Why should I expect this? The stock was trading above fair value. I Hear the Train Coming! In late 2014 and early 2015, a confluence of news and events started to bang down railroad stocks. The price of oil plummeted, causing a perceived huge loss of crude-by-rail volumes, as well as oilfield materials. Coal shipments got soft. Striking longshoremen shut down Long Beach and LA container ports. Rail safety regulations were raised. Some investors fretted about the wider Panama Canal. Share prices began to fall. I agree some of the foregoing justified part of the decline. However, based upon historical P/E multiples, the shares were overpriced at $104. The stock ran up over $120. Did the business get much better to deserve that uplift? No. When shares went from $104 to $124.50 (the high), the underlying corporate fundamentals didn’t get better. The stock price and earnings just separated; and Union Pacific share price and earnings have a long history of following each other. General Rule #3: For the vast majority of stocks, price follows earnings and/or cash flow. Corollary: Sometimes stocks stay overvalued for a while. That’s ok. Don’t get greedy. Let’s look at an updated F.A.S.T. graph. It’s instructive: (click to enlarge) Despite all the media hoopla and brokerage house hand-wringing, we see that the price decline from $124 to 106 (a 15% correction) simply re-united Union Pacific stock price and earnings. UP 1Q 2015 Earnings: A Re-Calibration Opportunity During the 1Q 2015 earnings report, we found Union Pacific management wasn’t in a state of panic. Some facts: Operating earnings grew to $1.30 a share from $1.19 a year earlier A 64.8% operating ratio bested the full-year 2014 average Year-over-year net margins improved Operating cash flows were up YoY freight revenues were down 1%; volumes were down 2% During management’s earnings discussion and conference call, we learned that coal volumes are likely to remain soft throughout 2015. Energy transportation volumes are uncertain, but there’s no expectation of permanent impairment. Agriculture and automobile shipments are expected to be good. Intermodal transportation is forecast to recover in 2Q as west coast ports get back to business. Shares outstanding are down again on strong repurchase activity, and the first-quarter dividend was bumped up 10%. And while BNSF is rumbling to be get more competitive on some routes, Union Pacific expects 2015 “core pricing” to improve by 3.5%. Key Learning: The fundamental investment thesis outlined at the beginning of this article, set over 2 years ago…has not changed. Accumulating Shares To Rebuild The Position By March, the train arrived at the station. Share prices were “coming in,” falling below $110. Since March, here’s the action: Bought 20 shares @ $109 (a bit early, but refer to Rule #2!) Bought 20 shares @ $106 Bought 20 shares @ $104 Now, here’s one more general rule: General Rule: Don’t repurchase shares for more than you sold them. Never chase. Remember, I had distributed “60” shares at $119 and $121? Well, now I’ve bought these back at prices between $104 and $109. However, I “prematurely” sold the first “40” share block at $104. Therefore, I will not buy these last “40” shares back unless I can get them for AT LEAST a 7% discount. Otherwise, my net/net after tax could be a washout. I have placed a limit order and sold short puts, whereby I will not purchase additional long shares unless $97 or less. Conclusions Trading around a core position requires discipline and patience. Have a researched and complete investment thesis before buying any stock. Accumulate shares in increments. Determine at what price you believe this stock is overvalued. Distribute shares above your price. Sell down shares in increments. Never completely sell core positions, unless the ownership thesis has turned negative. When shares revert to fair value or less, you may begin to repurchase. Repurchase shares in increments. Only repurchase distributed shares at lower prices than those sold. Don’t chase. Union Pacific: Price, Volume and SMAs (2013-to-date) (click to enlarge) Courtesy of bigcharts.marketwatch.com Please do your own careful due diligence before making any investment. This article is not a recommendation to buy or sell any stock. Good luck with all your 2015 investments. Disclosure: The author is long UNP. (More…) The author wrote this article themselves, and it expresses their own opinions. The author is not receiving compensation for it (other than from Seeking Alpha). The author has no business relationship with any company whose stock is mentioned in this article.
Cold Weather Drove Up UNG – What’s Next?

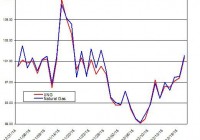
Summary The price of UNG have risen by 10% since the beginning of the month. The colder-than-normal weather is pushing up the price of UNG. The storage is projected to be 7% higher than the 5-year average by the end of the extraction season. Even though the energy market – mainly oil – continues to struggle, the natural gas market showed some early signs of recovery in recent weeks; shares of the United States Natural Gas ETF (NYSEARCA: UNG ) added 10% to their value since the beginning of the month. Will the ongoing colder-than-normal weather could keep pushing up the price of UNG? Despite the contango in natural gas futures markets, this hasn’t had a strong adverse impact on the price of UNG. Since the beginning of the year, the price of UNG underperformed the price of natural gas by only 0.4%. Looking forward, if the contango continues to expand, this could widen the gap between natural gas prices and UNG prices. (Data Source: EIA and Google Finance) In the past week, the extraction from storage was close to market expectations with a 111 Bcf withdrawal, which brought the total storage levels to 2,157 Bcf. This is 2.8% higher than the 5-year average and 45.8% above the levels recorded in the same week last year. The low extraction from storage was despite the spike in demand for natural gas in the northeast in recent weeks. In the past week, the demand for natural gas spiked by 23.1%, and was nearly 21.2% higher than the demand listed in the same week in 2014. Most of the gain was in the residential and commercial sectors. (Data Source: EIA) Assuming the extraction from storage were to remain 15% lower than the 5-year average (during the past 14 weeks, on average, the withdrawal from storage was 17% lower than the 5-year average), this could bring the storage levels to around 1,800 Bcf by the beginning of April (the time of injection season). This will be roughly 7-8% higher than normal. This week, the extraction from storage is likely to be, yet again, well below the 5-year average: The average deviation from temperatures was 5.07, which implies lower demand for natural gas for heating purposes than normal. In the next two weeks, temperatures are projected much lower than normal, mainly in the Midwest and Northeast. This means, at face value, another spike in demand for natural gas in the near term. This assessment is also strengthened by the expected sharp rise in heating degree days across the U.S. From the supply side, gross production remained flat, and most of the gain in supply came from higher imports from Canada. The recent update from Baker Hughes showed a cut down of 11 gas rigs in the last week, so the total rigs reached 289 rigs. So on the one hand, the rise in demand and the on the other the stagnation in the production contributed to the rally of UNG in recent weeks. The recent recovery in UNG is driven by lower-than-normal temperatures that are increasing the demand for natural gas for heating purposes. But the extraction from storage is still low and could bring the storage levels to well above normal levels by the end the extraction season. This factor could curb the recovery of UNG down the line. In the short term, unless the weather forecasts come to fruition (i.e. the weather will be hotter than expected), the price of UNG is likely to keep pushing upward. For more see: ” Has the Weakness in the Oil Market Fueled the Decline of UNG? ” Disclosure: The author has no positions in any stocks mentioned, and no plans to initiate any positions within the next 72 hours. (More…) The author wrote this article themselves, and it expresses their own opinions. The author is not receiving compensation for it (other than from Seeking Alpha). The author has no business relationship with any company whose stock is mentioned in this article.
This Is How You Invest In Oil Right Now (Without USO)

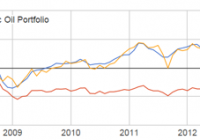
Summary Many investors are making big bets on oil since it bottomed last month. However, the oil futures curve is in extreme contango, making ETFs like USO and USL very costly. Until the curve flattens, non-integrated oil drillers are a much safer play. This article presents a dynamic model for oil investing to better capitalize on an oil turnaround. Note: This article originally appeared on Hedgewise in October 2014. It has been updated with additional data and republished. Introduction Just about everyone is betting on an oil turnaround sometime soon and trying to figure out how to capitalize on it. Unfortunately, most instruments that provide exposure to oil prices are riddled with high long-term holding costs. One of the most popular oil ETFs, The United States Oil ETF (NYSEARCA: USO ), often suffers from paying high premiums on futures contracts (called “contango”). As you can see here , these costs are particularly severe right now. Investing directly in companies which drill, distribute, or sell oil is a reasonable alternative, but these companies often fail to track the spot price of oil very closely. For example, in 2008, when oil went up 200% , Exxon Mobil (NYSE: XOM ) was only up 88%. This article breaks down the nature of this problem, and presents a dynamic methodology for investing in oil that seeks to avoid these pitfalls. A back-tested simulation that applies this logic can be seen in the graph below, under the label “Dynamic Oil Portfolio.” This portfolio is a rule-based index that invests in a single oil futures contract when the market is in backwardation, or a non-integrated oil company ETF when it is not. It significantly outperforms a long-term investment in USO, and has drastically outperformed in the last few months. This methodology can be applied to any portfolio by keeping track of current market conditions, and then choosing the appropriate ETF (or futures contract) accordingly. Comparison of the WTI Oil Spot Price, USO, and the Dynamic Oil Portfolio, May 2006 – February 2015 (click to enlarge) Sources: Energy Information Administration, Yahoo Finance, Hedgewise Internal Research The Problem First, it is worthwhile to do a quick review of the problems with investing in oil. The most direct way to invest is with an oil futures contract, which commits you to buying oil at an agreed upon price at some point in the future. Unfortunately, much of the time there is a premium on the price of oil futures, called “contango,” because people are betting the price of oil will go up. For example, say the current spot price of oil was $50, and you could buy a futures contract for next month at $55. If the price of oil were to stay exactly flat for the next month, you would probably lose about $5 on that contract. If this were to keep happening, you would lose about 10% per month for the entire year! How This Applies to Oil ETFs The effect of this problem can be seen by examining the performance of ETFs that specialize in trading oil futures contracts. For example, USO has a policy of rolling over the nearest oil futures contract every month. This results in significant cost whenever the market is in contango, which explains its underperformance over time. The iPath S&P Crude Oil Total Return ETN (NYSEARCA: OIL ) and the United States 12 Month Oil ETF (NYSEARCA: USL ) are affected in a similar way. Performance of USO, OIL, and USL vs. WTI Oil Spot Price, December 2007 – February 2015 (click to enlarge) Sources: Energy Information Administration, Yahoo Finance You might notice that USL has performed the best. This is because USL invests in 12 different futures contracts at all times while OIL and USO only invest in the futures contract of the nearest month. This has helped to avoid some of the dramatic costs of trading futures in periods of heavy speculation, such as early 2009. However, it is not enough to avoid the problem altogether. Still, the relative performance of USL provides an important insight. Since different oil futures contracts trade at different prices, there is an opportunity to pick the cheapest one at any point in time. This is the mandate of the PowerShares DB Oil ETF (NYSEARCA: DBO ), and, in theory, should lead to improved performance. Unfortunately, in practice, it has not. Performance of USL and DBO vs. WTI Oil Spot Price, December 2007 – February 2015 (click to enlarge) Sources: Energy Information Administration, Yahoo Finance The main reason that DBO has failed to outperform USL is because of the consistency of the futures curve. It is often upward sloping over time, such that the adjusted cost is about the same no matter which contract you buy. It is helpful to zoom in on different time periods to get a better sense of how this works. You might have already observed how well DBO and USL performed from January 2008 to January 2009. We can examine the futures curve over that time period to understand why this was possible. Note that a “2-Month Oil Futures” contract is one that expires 2 months from today, and a “4-Month Oil Futures” contract is one that expires 4 months from today. If the “4-Month” price is higher than the “2-Month” price, this indicates that the market is in contango. WTI Oil Spot Price vs. 2-Month and 4-Month Futures Contract Prices, January 2008 to January 2009 (click to enlarge) Source: Energy Information Administration The important observation is how close the price of both futures contracts was to the spot price over this entire period. In fact, at some points, the price of the futures contracts was actually below the spot price, which is a case of backwardation. This allowed USL and DBO to outperform. However, this trend changed dramatically in 2010. WTI Oil Spot Price vs. 2-Month and 4-Month Futures Contract Prices, January 2010 to January 2011 (click to enlarge) Source: Energy Information Administration Here, the futures curve was upward sloping, with the price of the 4-Month contract consistently above that of the 2-Month contract. As a result, all of the ETFs involved in trading oil futures suffered. This demonstrates the general point that if you are going to get oil exposure using futures (whether directly or via ETFs), you need to be constantly monitoring the futures curve and adjusting accordingly. When the curve is upward sloping, trading futures will cost a hefty sum over the long term. Unfortunately, this has been the case about 60% of the time over the past decade. Thus, it is necessary to identify alternative ways to get oil exposure, such as investing directly in individual companies. Investing Directly in Oil Companies The most obvious candidates for direct investing are the two largest energy ETFs, the Energy Select Sector SPDR ETF (NYSEARCA: XLE ) and the Vanguard Energy ETF (NYSEARCA: VDE ). Both ETFs invest in most of the biggest energy companies in the world. Performance of XLE and VDE vs. WTI Oil price, June 2006 – February 2015 (click to enlarge) Sources: Energy Information Administration, Yahoo Finance This performance is not terrible, but there is a great deal of tracking error. While in this period the overall effect has been positive, it could just as easily have been negative as it was from 2008 to 2009. The nature of this tracking error can be traced back to the fundamentals of the oil market. First, most large energy companies are grouped into the ‘oil & gas’ sector. This is because natural gas is often found alongside oil, and comprises a significant part of their business. However, the price movements of natural gas are often uncorrelated to the price movements of oil. Second, there are three main functions in the oil industry. Exploration and drilling Equipment and transportation Retail sales Many of the big oil players are involved in all three functions, but equipment, transportation, and retail sales don’t really depend on the current price of oil. For example, if you are selling oil equipment, you would not expect short-term oil fluctuations to change your sales outlook. If you are a gas station, you receive a small mark-up on the price of oil after buying it wholesale. Only exploration and drilling companies (a.k.a., ‘non-integrated’ oil companies) have very direct exposure to oil prices since they are the ones who actually own the oil fields. The good news is that there are ETFs which track these non-integrated oil companies. Two of the largest are the iShares U.S. Oil & Gas Exploration & Production ETF (NYSEARCA: IEO ) and the SPDR S&P Oil & Gas Exploration & Production ETF (NYSEARCA: XOP ). Performance of IEO and XOP vs. WTI Oil Spot Price, June 2006 – February 2015 (click to enlarge) Sources: Energy Information Administration, Yahoo Finance Surprisingly, these stocks actually have an even higher tracking error. To understand why, we have to take a look at the largest actual holdings within the ETFs. XOP primarily invests in smaller-sized owner-operators of oil fields, such as Magnum Hunter Resources Corp. (NYSE: MHR ) and Western Refining, Inc. (NYSE: WNR ). Performance of MHR and WNR vs. WTI Spot Oil Price, June 2006 – February 2015 (click to enlarge) Sources: Energy Information Administration, Yahoo Finance The problem is that these small companies are hugely susceptible to swings due to idiosyncratic factors, like their recent discoveries and the prospects for their particular oil fields. As such, they are fairly uncorrelated to the price of oil. It makes more sense to focus on companies which are diversified across many oil sources rather than only a few, which is the focus of IEO. Two of their biggest holdings are the Anadarko Petroleum Corporation (NYSE: APC ) and EOG Resources, Inc. (NYSE: EOG ), both big drilling companies. Performance of APC and EOG vs. WTI Spot Oil Price, June 2006 – February 2015 (click to enlarge) Sources: Energy Information Administration, Yahoo Finance There is still company-specific variance, but it is muted because these companies are better diversified. Because of this, IEO is likely a better play on oil exposure than XOP. However, it remains unclear whether IEO is a better option than the bigger ETFs; XLE and VDE. Unfortunately, there is no way to make a determination on numbers alone. All three of the ETFs hold oil companies that also invest in natural gas. Each of those companies will have independent factors that affect it year to year. It seems logical that non-integrated oil companies would be more directly exposed to fluctuations in the oil price than the bigger players involved in equipment, transportation, and retail sales. Yet, their relative performance suggests the difference thus far has been pretty negligible. All three are probably reasonable alternatives when the futures market is in contango. Performance of IEO, XLE, and VDE vs. WTI Spot Oil Price, June 2006 – February 2015 (click to enlarge) Sources: Energy Information Administration, Yahoo Finance How to Apply the Model The outcome of all this logic is relatively simple. Invest in the cheapest futures contract (optimizing between USO, USL, and DBO if using an ETF) when there is a downward sloping futures curve, and use a general energy ETF like IEO, XLE, or VDE otherwise. While this requires a little extra work, it may drastically reduce the costs of investing in oil over the long run. We’ve also made this a little easier for you by tracking the current state of the futures curve and its estimated impact on each ETF (linked above). Though the outcome of this model is not perfect, it is certainly more compelling than many of the alternatives. Disclosure: Hedgewise is an Investment Advisor that helps clients implement custom strategies like the one described in this article inexpensively and tax-efficiently. This information does not constitute investment advice or an offer to invest or to provide management services and is subject to correction, completion and amendment without notice. Hedgewise makes no warranties and is not responsible for your use of this information or for any errors or inaccuracies resulting from your use. To the extent that any of the content published may be deemed to be investment advice or recommendations in connection with a particular security, such information is impersonal and not tailored to the investment needs of any specific person. Hedgewise may recommend some of the investments mentioned in this article for use in its clients’ portfolios. Disclosure: The author is long IEO, XLE. (More…) The author wrote this article themselves, and it expresses their own opinions. The author is not receiving compensation for it. The author has no business relationship with any company whose stock is mentioned in this article.