Tag Archives: premium-authors

How To Catch A Falling Knife

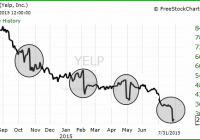
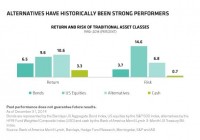
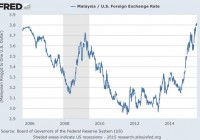
Summary The “falling knife” stock is increasingly common. The current economic environment increases risk in falling stocks. One long-established investment technique can minimize the risk. Falling knife: A security or industry in which the current price or value has dropped significantly in a short period of time. A falling knife security can rebound, or it can lose all of its value, such as in the case of company bankruptcy where equity shares become worthless. –Investopedia Remember Boston Chicken? Inspired by the heady days of the late ’90s and my personal effort to improve their top line, I watched BOST decline in price and finally made a major share purchase when it was so low I could not resist. To this day I maintain that no company can go broke trying to sell too much fat, salt, and sugar to the American public. This axiom was overcome by BOST’s incestuous finances and the practice of selling one dollar of chicken for 95 cents, which led to bankruptcy in 1998. A $50 check from the subsequent class action lawsuit did little to assuage my five figure loss. There were many lessons to be had from this experience. The one I want to concentrate on is the value of dollar cost averaging, or DCA, in purchasing stocks that are declining in price. DCA refers to planned purchases in multiple increments over time, in contrast to a one time purchase of the full investment. If I had used DCA with Boston Chicken, my loss would have been much less severe. DCA is useful in many circumstances, but its benefits are magnified in cases where a stock is in a significant decline. The Falling Knife Scenario The classic falling knife scenario consists of an abrupt price change. Yelp is a particularly hair-raising example: A broader definition of “falling knife” is any stock that is in a clear price decline over a period of time. Under this definition there are many falling knives among today’s investment choices. Every day articles appear on Seeking Alpha enthusiastically recommending a purchase because stock X is N per cent off its high. Readers will often note that such articles have appeared since a decline began. Here are three companies in the falling knife category that have had bullish articles all the way down: American Capital Agency (NASDAQ: AGNC ), Emerson Electric (NYSE: EMR ), Chevron (NYSE: CVX ): How long and how severe these declines will be no one knows. At losses from 52 week highs of 22%, 19%, and 30% for EMR, AGNC and CVX there could still be a lot of air underneath them. Other widely held falling knives include: Exxon Mobil (NYSE: XOM ). Intel (NASDAQ: INTC ), Caterpillar (NYSE: CAT ), Freeport-McMoRan (NYSE: FCX ), BHP Billiton (NYSE: BBL ) (NYSE: BHP ), National Oilwell Varco (NYSE: NOV ), and 3M (NYSE: MMM ). The DCA Effect Using Chevron as an example the usefulness of DCA is clear. An investment of $30,000 when CVX had declined 10% from its high of $130 would buy 256 shares: Date Price Investment Shares 10/02/2015 $117 $30,000 256 Value 08/01/15 $88 $22,528 256 An investment in three increments over equal time periods would buy 293 shares: Date Price Investment Shares 10/02/2015 $117 $10,000 85 03/01/2015 $105 $10,000 95 08/01/20015 $88 $10,000 113 Value 08/01/15 $88 $25,784 293 The DCA approach buys 37 more shares, $3,256 more in value, and $159 more in annual income. If CVX returns to $130, the price at which it started, the difference in total value rises to $4,810. It is true that there is a possibility of losing out on some gains if a stock rises in value between purchases. But as Daniel Kahneman wrote in classic book Thinking, Fast and Slow : Losses loom larger than gains. The “loss aversion ratio” has been estimated in several experiments and is usually in the range of 1.5 to 2.5. For the average investor, the good feelings you get from gains are more than wiped out by the bad feelings from losses. Perhaps humans have an instinctual aversion to loss of capital. Why is DCA important now? DCA has strengths that apply to all circumstances, such as reducing risk and replacing emotion with discipline. In today’s markets its benefits are particularly important. After six years of almost uninterrupted rise in stock prices, recency bias is very strong. Recency bias causes investors to believe trends and patterns have observed in the recent past will continue in the future. Investors look at where a stock has been, not where it is going. Complacency among investors is high. New investors have with no experience of a declining market have an inflated sense of their stock-picking ability. Older investors, with six years of mostly positive experience, may think that their prowess has improved more than it has. Price declines reflect changes in the macroeconomic situation. Global growth estimates continue to be lowered. Money is no longer being added to the US system through quantitative easing, and as shown by Eric Parnell and others there has been a strong relationship between QE and stock market performance. In addition, numerous indicators have been flashing warning signs for some time. DCA is agnostic concerning market projections but economic changes do affect results. Conclusions The falling knife conundrum — what to do when a stock we like is falling — is increasingly common. The angel on one shoulder tells us to buy and the angel on the other shoulder tells us not to lose money. Dollar cost averaging is a way to resolve these different impulses. DCA is helpful in many situations, but particularly today when uncertainty is increasing and six years of successful stock-picking may have inflated both our confidence in the market and the perception of our abilities. DCA takes away the pressure of having to make a one-time purchase decision, allows us to act independently of market noise, and reduces risk. Disclosure: I/we have no positions in any stocks mentioned, but may initiate a long position in XOM EMR over the next 72 hours. (More…) I wrote this article myself, and it expresses my own opinions. I am not receiving compensation for it (other than from Seeking Alpha). I have no business relationship with any company whose stock is mentioned in this article.

Do Your Alternative Investments Have The Right Fit?

By Richard Brink, Christine Johnson Investors who chose alternatives for downside protection in recent years have been frustrated with their performance. We think the problems were an unfavorable market environment and the unique challenges of manager selection for alternatives. In May 2013, the market’s “taper tantrum” in reaction to announced changes in U.S. monetary policy pushed bond yields up; stocks stumbled briefly before continuing to pile up strong returns. For many investors, this heightened concerns about extended market valuations and an impending interest-rate increase. Taking a page from the typical playbook, many investors looked toward long/short equity strategies and nontraditional bonds as ways to protect against potential market downside. But in 2014, playing defense didn’t pay off: U.S. equity markets gained another 14% and bond yields fell. Long/short equity strategies, on average, returned 4%. That experience left many investors disappointed with alternatives-both equity-oriented and fixed income-oriented. It hardly came as a surprise when investors shifted money out of alternatives early in 2015, moving it into core fixed-income funds and international equities-mostly through passive exchange-traded funds (ETFs). The Long-Term Value of Alternatives We think investors were right in looking to alternatives for protection against potential downturns. Alternatives have provided better returns than stocks, bonds or cash over the past 25 or so years, with less than half the volatility of stocks ( Display ). And long-term data show that incorporating alternatives in a traditional portfolio may enhance returns and reduce risk. If that’s the case, what went wrong in 2014? We think the problem was twofold. First, a good portion of alternatives’ poor performance stemmed from the multiyear, largely uninterrupted bull-market run. This extended rally rendered the long-term benefit of “hedging” with alternatives somewhat moot. Second, many investors bought the right idea of alternatives: participation in all markets with downside protection. But in many cases, they didn’t buy the specific behavior in an alternative that was the best fit for their portfolio and risk/return preferences. It’s not an easy selection process. There are thousands of different alternative strategies to choose from and a lot of dispersion among managers within alternative categories. It’s not enough to simply buy a top performer from a seemingly relevant category. It’s critical to have specific characteristics in mind: Exactly how much downside protection do you want? And how much participation in up markets are you looking for? Once you know your objectives, you can start doing the homework to zero in on a strategy and manager that aligns with them. What’s in an Alternative Category? Everything One of the challenges to finding the right fit is that alternative categories have a lot more variety than their traditional equivalents. They just don’t provide as much help in narrowing down the decision. Take Morningstar indices. They have about 40 different categories for traditional, or long-only, equities. There are categories for different geographies, market capitalization ranges, styles and even sectors. For long/short equities, there’s only one category. If an investor wants to find the right long/short equity strategy, it takes a lot of legwork to uncover the one with the best fit. Without that, investors are at the mercy of manager dispersion. Three Levers That Create Manager Dispersion What creates such big dispersion among alternative managers? We think three levers are at play: style, market risk and approach. We talked about the first lever already: the traditional style buckets of geography, investment approach, market capitalization and industry/sector make for a lot of differences. The second lever is how much overall market risk and sensitivity a manager has-a lot or a little-and how much it varies depending on conditions. The third lever is the approach a manager uses to create the portfolio’s overall market exposure. For example, does the manager use cash, market hedges or short positions in individual stocks? What mix of these instruments does the manager use, and in what environments? All three elements and their combinations can vary to define your experience with a specific alternative manager’s approach. Conducting three-dimensional research to gain a clear understanding of the levers-and which settings are best for you-is the key to choosing the right alternative manager. And the need to make that choice is rather pressing today, in our view. There aren’t a lot of broad cheap areas in capital markets today, and we expect more modest returns and higher volatility ahead for both stocks and bonds. Relying on broad market returns alone isn’t likely to be as rewarding in the years to come, and alternatives can play a key role in enhancing a portfolio’s risk/return profile. The views expressed herein do not constitute research, investment advice or trade recommendations and do not necessarily represent the views of all AB portfolio-management teams.

Malaysia: Truly A Bear Market

The Trend Is Your Friend for the Malaysia’s stock market and currency. Sell the iShares MSCI Malaysia ETF on worsening economic fundamentals, worsening technicals and worsening sentiment. The looming unwind of the global carry trade and a relatively pricey valuation for EWM means a further 20% drop in price by year end is highly likely. Malaysia is in big trouble. Its currency and stock markets are in bear markets with no sign things getting better any time soon. First of all, the country has weak economic fundamentals. Analysis by the Malaysian Institute of Economic Research, dated 4h August 2015, shows that the important indicators of consumer confidence, retail trade, employment and residential property are all pointing to weaker economic growth conditions. Then there is the country’s deteriorating terms of trade situation. In 2014 commodity exports accounted for 26% of exports and 18% of GDP. With palm oil, crude and refined products and natural gas, Malaysia’s key export commodities all heading lower, this is putting pressure on Malaysia’s fiscal situation. But don’t lower commodity prices hit many emerging markets? Yes, but in actual fact Malaysia is the only country within the Association of South East Asian Nations region that does not benefit from lower oil prices. This means that Bank Negara the country’s central banks will likely need to ease, weakening the ringgit further. This would be a bad development for the iShares MSCI Malaysia ETF (NYSEARCA: EWM ). The ringgit which is at ten year lows and broke though the key technical level of 3.7 ringgits to the dollar is in a strong bear market and monetary policy divergence is set to make the currency weaker. (click to enlarge) Although a weaker currency could help exports in theory, Malaysia has little room for credit expansion to spur domestic consumption and investment. According to the IMF Malaysia’s debt to GDP stands at 165% – one of the highest of all emerging market countries. This means the ” monetary transmission mechanism ” by which lower policy rates should help economic conditions may not be very effective. With EWM dropping from its 52 week high $16.32 to below $12, hasn’t the market already priced in a lot of these negative factors in already? I don’t think so – with a trailing P/E ratio of 16 times, the market is not cheap. Additionally, Malaysian stocks are highly susceptible to a de-rating once the Fed raises interest rates and fast money investors with their global carry trades accelerate their unwinding of risky asset holdings. That’s because as funding costs creep up for carry trades, the risk return of carry trades in Emerging Markets looks increasingly less favorable, and with fast money investors all conscious of the positioning of other like-minded investors it’s likely that they will be inching nearer to the exit door in order to get out first. This situation and a potential rush to sell could lead to a self-fulfilling prophecy in so many of the higher risk and especially commodity linked markets like Malaysia. For EWM the $12 mark was also a key technical level, as it has been both a support and resistance level several times since 2007 – see chart below. The next key technical level appears to be $10. (click to enlarge) Furthermore, global investors have no doubt been troubled by the ongoing scandal in Malaysian politics concerning the Prime Minister Najib Razak’s personal finances. At a time when Japan is steadily improving its corporate governance, other Asian countries need to do everything to keep up on this front because unlike Japan, countries like Malaysia are unable to implement quantitative easing without spurring massive inflation. The key risk to my thesis is if oil prices were to rally hard or if the policy divergence between the Fed tightening and Bank Negara’s likely easing were to turn around. These two scenarios would alleviate the economic fundamentals somewhat and support a market valuation of 16 times earnings in my view. However, I view this outcome as very low probability. The bottom line is Malaysia is a falling knife. There is no catalyst on the horizon which suggests attempting to pick a bottom could be successful. Investors with the ability to short, should short EWM. Long only investors who want exposure to Asia can find better alternatives. Disclosure: I/we have no positions in any stocks mentioned, but may initiate a short position in EWM over the next 72 hours. (More…) I wrote this article myself, and it expresses my own opinions. I am not receiving compensation for it (other than from Seeking Alpha). I have no business relationship with any company whose stock is mentioned in this article.