Tag Archives: premium-authors

Best And Worst Q3’15: Telecom Services ETFs, Mutual Funds And Key Holdings

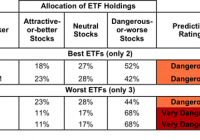
Summary Telecom Services sector ranks seventh in Q3’15. Based on an aggregation of ratings of six ETFs and 12 mutual funds. PBS is our top-rated Telecom Services ETF and FWRLX is our top-rated Telecom Services mutual fund. The Telecom Services sector ranks seventh out of the 10 sectors as detailed in our Q3’15 Sector Ratings for ETFs and Mutual Funds report. It gets our Dangerous rating, which is based on an aggregation of ratings of six ETFs and 12 mutual funds in the Telecom Services sector. See a recap of our Q2’15 Sector Ratings here. Figure 1 ranks all five ETFs and Figure 2 ranks the five best and worst mutual funds in the sector that meet our liquidity standards. Note that even the best Telecom Services ETFs fail to earn an Attractive-or-better rating. Not all Telecom Services sector ETFs and mutual funds are created the same. The number of holdings varies widely (from 23 to 55). This variation creates drastically different investment implications and, therefore, ratings. Investors should not buy any Telecom Services ETFs or mutual funds because none get an Attractive-or-better rating. If you must have exposure to this sector, you should buy a basket of Attractive-or-better rated stocks and avoid paying undeserved fund fees. Active management has a long history of not paying off. Figure 1: ETFs with the Best & Worst Ratings – Top 5 (click to enlarge) * Best ETFs exclude ETFs with TNAs less than $100 million for inadequate liquidity. Sources: New Constructs, LLC and company filings The SPDR S&P Telecom ETF (NYSEARCA: XTL ) is excluded from Figure 1 because its total net assets are below $100 million and do not meet our liquidity minimums. Figure 2: Mutual Funds with the Best & Worst Ratings – Top 5 (click to enlarge) * Best mutual funds exclude funds with TNAs less than $100 million for inadequate liquidity. Sources: New Constructs, LLC and company filings The Rydex Series Telecommunications Fund (MUTF: RYMIX ) (MUTF: RYMAX ) (MUTF: RYCSX ) is excluded from Figure 2 because its total net assets are below $100 million and do not meet our liquidity minimums. The PowerShares Dynamic Media Portfolio ETF (NYSEARCA: PBS ) is the top-rated Telecom Services ETF and the Fidelity Select Wireless Portfolio (MUTF: FWRLX ) is the top-rated Telecom Services mutual fund. PBS earns a Dangerous rating and FWRLX earns a Neutral rating. The ProShares Ultra Telecommunications ETF (NYSEARCA: LTL ) is the worst-rated Telecom Services ETF and the Rydex Telecommunications Fund (MUTF: RYTLX ) is the worst-rated Telecom Services mutual fund. Both earn a Very Dangerous rating. 43 stocks of the 3000+ we cover are classified as Telecom Services stocks, but due to style drift, Telecom Services ETFs and mutual funds hold 55 stocks. Inteliquent Inc. (NASDAQ: IQNT ), on the Most Attractive Stocks List in July , is one of our favorite stocks held by Telecom Services ETFs and mutual funds and earns our Very Attractive rating. Since 2007, Inteliquent has grown after-tax profit ( NOPAT ) by 24% compounded annually. In addition to strong profit growth, the company improved its return on invested capital ( ROIC ) to 28% from 11% in 2012. Despite the strong underlying business performance, IQNT remains undervalued. At its current price of $18/share, Inteliquent has a price to economic book value ( PEBV ) ratio of 1.1. This ratio implies that the market expects NOPAT to grow by 10% from its current level. If Inteliquent can grow NOPAT by 7% compounded annually for the next decade, the stock is worth $24/share today – a 33% upside. Cincinnati Bell, Inc. (NYSE: CBB ) is one of our least favorite stocks held by Telecom Services ETFs and mutual funds and earns our Very Dangerous rating. Over the past five years, Cincinnati Bell’s NOPAT has declined by 19% compounded annually. Even worse, Cincinnati Bell has failed to create shareholder value by failing to generate positive economic earnings for 11 consecutive years. Despite years of poor business fundamentals, CBB is overvalued. To justify its current price of ~$4/share, Cincinnati Bell must grow NOPAT by 9% compounded annually for the next 12 years. Owning this stock and, ergo, betting on the company to pull off such an extended turnaround given its recent struggles is quite risky. Figures 3 and 4 show the rating landscape of all Telecom Services ETFs and mutual funds. Figure 3: Separating the Best ETFs From the Worst ETFs (click to enlarge) Sources: New Constructs, LLC and company filings Figure 4: Separating the Best Mutual Funds From the Worst Mutual Funds (click to enlarge) Sources: New Constructs, LLC and company filings D isclosure: David Trainer, Kyle Guske II, and Max Lee receive no compensation to write about any specific stock, sector or theme. Disclosure: I/we have no positions in any stocks mentioned, and no plans to initiate any positions within the next 72 hours. (More…) I wrote this article myself, and it expresses my own opinions. I am not receiving compensation for it. I have no business relationship with any company whose stock is mentioned in this article.
UWTI: Forget About Growth

Originally published on August 6, 2015 VelocityShares 3X Long Crude ETN (NYSEARCA: UWTI ) is set to close down strongly on Thursday morning as oil traders worry that the market is far from a takeoff. An Oppenheimer report on the market suggested that the cut in supplies by producers won’t be enough to save them from the glut in the market, and much pain ahead. Fadel Gheit, who wrote the report for the research house, said that recent reports from the oil firms were a sign of shifting market outlook. “The priority now is to discontinue budget spending. The priority is to live within your means. Forget about growth. They are now in survival mode.” Oil pumpers slash budgets Mr. Gheit was commenting the recent changes to outlook seen in the earnings report of some of the biggest oil firms in the world. Chesapeake has cancelled its payouts to shareholders , Exxon Mobil (NYSE: XOM ) has slashed its capital spending and Royal Dutch Shell (NYSE: RDS.A ) (NYSE: RDS.B ) has cut more than 6,000 jobs . At the root of the trouble is OPEC . The global oil cartel has decided to keep its supply high despite the price of Brent falling below $50. Shell CEO told investors that his firm is “planning for a prolonged downturn.” Those betting on the VelocityShares 3X Long Crude ETN may want to do the same. Mr. Gheit said that major oil firms were “still not willing to abandon their rosy forecasts,” but, “at least they are addressing the near-term situation that we have to do something now and not wait for oil prices to recover.” Supply of oil is set to fall over the coming years because of lower investment from firms across the world, but it’s still not going to be enough to allow oil makers, or the price of the black liquid, to grow by a huge margin. VelocityShares 3X Long Crude ETN gets crushed After open this morning the VelocityShares 3X Long Crude ETN was trading for $1.28, down 4.1 percent for the day so far. Those who have been trading the ETF in the hope of a surprise oil spike have been hit hard in recent weeks as Iran’s coming entry into the global market keeps pushing prices lower. In the last month the ETN has lost more than 40 percent of its value. It has lost more than 70 percent since the year began. Rumors that VelocityShares 3X Long Crude ETN will be forced into a reverse split have not yet been met with any facts to back them up, but if prices keep crashing there may be no other option. Leveraged ETFs are not for the faint of heart and 3X oil, much like its gold cousins, has been a very difficult market to make money in in 2015. That trend may continue through the second half of the year and those that don’t know what they’re doing should reduce their exposure and stop trying to time a market that’s controlled by a cartel thousands of miles away. Original Post

Evaluating U.S. Low-Volatility ETFs: USMV Vs. SPLV

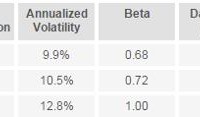
Low-volatility ETFs have close to $20 billion in AUM. Both USMV and SPLV achieve their objectives against the benchmark. USMV has been the more efficient and cheaper choice than SPLV thus far. Ever since I wrote my thesis on minimum-variance portfolios six years ago, I have maintained a strong interest in low-volatility investing. This type of investment has gained popularity over the last few years with the US markets now featuring 21 low-volatility ETFs that have combined assets under management of almost $20 billion. I have decided to take a look at how the largest funds in this space have performed from the risk perspective. For the purpose of this analysis, I have focused on the two flagship low-volatility ETFs – the iShares MSCI USA Minimum Volatility ETF (NYSEARCA: USMV ) and the PowerShares S&P 500 Low Volatility Portfolio ETF (NYSEARCA: SPLV ) – which have around $5 billion of AUM each. Both of these funds invest solely in the US stock market, making them easy to compare. The SPDR S&P 500 Trust ETF (NYSEARCA: SPY ) is used as the benchmark. Utilizing the freely available investor tool on InvestSpy and using the full data history, I obtained the following results: (click to enlarge) The table above reveals that both USMV and SPLV demonstrated substantially reduced beta and realized volatility than SPY. However, the degree of success differed, as USMV had a lower beta (0.68 vs. 0.72) and lower realized volatility (9.9% vs. 10.5%) compared to SPLV, making the former a superior performer from the risk perspective. In addition to that, USMV delivered a 6.7% higher total return than SPLV whilst both low-volatility ETFs trailed SPY. Looking at the correlations computed on the same analytical website, it turns out that both funds had a correlation with SPY of 0.88. Although the figure is relatively high, this is still a favorable finding given that these funds invest pretty much in the same universe of stocks as SPY. Analyzing the data only for the last year yields a similar result, as USMV again outperforms SPLV in all respects. However, the overall benefit from the low-volatility phenomenon has been weaker over the last 12 months, as beta values increased above 0.8 and annualized volatility was much closer to that of SPY’s, particularly in the SPLV’s case. (click to enlarge) The correlation coefficients have also changed in the past year with USMV and SPLV moving even closer together. It is interesting to note that USMV’s correlation coefficient with SPY has increased sharply to 0.95, making it a less desirable portfolio component from the diversification perspective. Summing up, USMV appears to have beaten SPLV thus far virtually in all respects, posting lower beta, lower realized volatility and higher returns. In addition to that, USMV was also a cheaper alternative, charging 0.15% as opposed to 0.25% by SPLV. However, it is important to note that markets constantly evolve and investors should monitor the performance of “smart beta” products on a regular basis. It is hard to make a case for SPLV now, but a simple change such as the recent spike in correlation with the S&P 500 may easily put USMV out of favor. Disclosure: I/we have no positions in any stocks mentioned, and no plans to initiate any positions within the next 72 hours. (More…) I wrote this article myself, and it expresses my own opinions. I am not receiving compensation for it (other than from Seeking Alpha). I have no business relationship with any company whose stock is mentioned in this article.