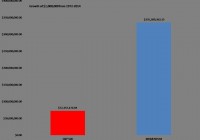
Strategy diversification may be superior to traditional methods. Momentum and trend following could provide protection during down markets. We demonstrate a simple system that can be replicated using low cost index funds. In a follow up to our recent article, Value Based Asset Allocation , we wanted to introduce you to our method for diversification. Unlike financial theory, we do not believe that diversification is sufficient for shielding a portfolio against large declines. Our view is that strategy diversification goes a long way to properly diversify a traditional asset allocation, especially during periods of market stress. Momentum is simply using price to determine the appropriate allocation. Price works as the ultimate indicator because of supply and demand. The irrefutable law of supply and demand has been the ultimate guide to navigating markets for centuries. Supply and demand governs how prices move. Therefore, price tells the true story. For example, if there are more buyers than sellers, prices will rise. If there are more sellers than buyers, prices will fall (Dorsey, 2007). Understanding what force is governing the market is critical to making allocation decisions. If supply is in control, you will want to avoid that market. On the other hand, you will want to invest in a market where demand is the stronger force. Momentum investing, by our definition, is allowing price to determine the investment allocation. It is about maintaining a harmonious relationship with the market. The idea is that the market is the sum total of all the investment experience and expertise of the market participants. The collective knowledge of the group is, in theory, superior to the individual’s over the long term. It is better to exist within a synchronous association rather than in opposition. As John Maynard Keynes suggested, “The market can stay irrational longer than you can remain solvent.” According to a trend follower, “Mr. Market” is always right, no matter how seemingly irrational. Momentum strategies have delivered superior performance to buy and hold investing (Berger, Israel and Moskowitz, 2009) . Meb Faber used a simple moving-average system to allocate to the S&P 500 or cash, demonstrating that he could reduce the correlation of his strategy to the S&P 500 in down markets to -0.38 and maintain a positive correlation of 0.83 during positive years (Faber & Richardson, 2009) . The implications of this study are profound. They indicate that by using a simple trend-following system, one can create a strategy to reduce correlation to equities when most other correlations are rising. When correlations rise during periods of market uncertainty, portfolio risk increases. Faber provides a simple solution to this particular conundrum despite using the S&P 500 as the investment vehicle. Momentum and trend following are strategies used to diversify a portfolio and cut market risk through the avoidance of large slumps. We use momentum in order to take advantage of positive herd mentality and avoid negative herd mentality. We alternate between risk-on and risk-off, dependent on the price trend of stocks and bonds. Capitalizing on the short term and herd mentality allows the investor to gain access to a return stream that does not always move in tandem with stocks and bonds. For example, during the time period from 2007 to 2009, the stock market (S&P 500) collapsed over 55 percent. Many managed-futures managers or commodity-trading advisors (CTAS) showed positive returns. Managed-futures managers are largely trend followers. Consequently, the managed-futures traders were negatively correlated with stocks and provided the ultimate diversification to a traditional portfolio. The time period from 2007 to 2009 is not unique. During several other market declines and reductions in traditional asset classes, trend-following traders demonstrated the ability to take advantage of the scrambling herd and capture impressive gains. Trend following seems high risk to many investors who still look at risk as volatility. Many momentum systems actually have higher volatility than the market. The fact is that volatility is not risk, and “the acceptance of higher risk in a trend-following investment can actually lower the risk of your stock and bond portfolios because when trend following zigs, typical stock and bond investments zag.” (M.W. Covel, 2009) Trend following appears to be an elixir for the behavioral ills of investing. Herd mentality, overconfidence, representativeness, anchoring effects, and loss aversion are all dealt with through systematic trend following, or momentum investing. We can use a simple system with indexes to replicate a strategy that protects during market declines without sacrificing the upside. In our strategy we use indices (baskets of securities tracking a particular market) to gain exposure because of their relatively low costs and high transparency. To illustrate the effectiveness of trend following historically, we are going to provide a simple, rules-based system as an example. The rules are as follows: Rank the S&P 500, Russell 2000, and the US 10-Year Treasury bond based on the three-month performance. Pick the strongest index based on the ranking. Run the ranking system each month. The important information to gather from the historical results is the performance of the momentum strategy during the years when the market declines. The ability to rotate away from the stock market when the price deteriorates allows for better performance when trouble is present. The core tenet of trend following and momentum investing is the protection of capital. Hence, the momentum strategy demonstrates the most significant outperformance during periods in which the overall stock market is experiencing large declines. The strategy performs well during positive stock market environments as well. The portfolio can be invested in the stock market when the trend is positive and stocks are stronger than bonds. In other words, the simple momentum system acts as a risk reducer during the down markets without sacrificing profits during up markets. The momentum strategy has done well compared to the S&P 500 since 1972. In the chart below, we illustrate the results to better demonstrate the benefits of incorporating trend following. If you had invested $1 million in the S&P 500 in the beginning of 1972, your investment would have grown to over $72 million by the end of 2014. If you had invested your $1 million during the same period using our momentum strategy, it would have grown to over $335 million. That is significant outperformance. Remember that the model can only maximize returns up to what the market earns. The outperformance comes from avoiding the down markets. (click to enlarge) The momentum system does not avoid declines. Since the end of 1971, there have been nine years in which the S&P 500 declined. Over the past forty years, the momentum strategy declined seven times. The beauty of momentum strategy lies in avoiding the big declines. The strategy never suffered a loss of greater than 7 percent in any given year. In comparison, the market suffered five declines over 10 percent, of which three were over 20 percent. Investors have to minimize the big declines to succeed when investing. The momentum system is able to accomplish the task of protecting the investors during big market declines, helping the portfolio grow more over the long term. As we have outlined above, momentum has historically worked to participate in up markets and protect against deep market declines. While we cannot predict the future trajectory of prices, we know that markets will fluctuate, and we have designed portfolios to potentially take advantage of market volatility. Trend-following traders have demonstrated their ability to navigate the uncertain markets and capitalize on turmoil. Trend following is not only reserved for the Wall Street elite or the ultra-rich. You can apply the same principles to diversify your portfolio using simple index funds and at a fraction of the cost of paying a manager. Disclosure: I/we have no positions in any stocks mentioned, and no plans to initiate any positions within the next 72 hours. (More…) I wrote this article myself, and it expresses my own opinions. I am not receiving compensation for it. I have no business relationship with any company whose stock is mentioned in this article. Additional disclosure: HYPOTHETICAL PERFORMANCE RESULTS HAVE MANY INHERENT LIMITATIONS. NO REPRESENTATION IS BEING MADE THAT ANY ACCOUNT WILL OR IS LIKELY TO ACHIEVE PROFITS OR LOSSES SIMILAR TO THOSE SHOWN. IN FACT, THERE ARE FREQUENTLY SHARP DIFFERENCES BETWEEN HYPOTHETICAL PERFORMANCE RESULTS AND THE ACTUAL RESULTS SUBSEQUENTLY ACHIEVED BY ANY PARTICULAR TRADING PROGRAM. PAST RESULTS DO NOT GUARANTEE FUTURE RETURNS. HYPOTHETICAL PERFORMANCE FOR ILLUSTRATION PURPOSES ONLY.