Tag Archives: portfolio-strategy

Monday Morning Memo: ESG Criteria As A Tool For Stock Selection

By Detlef Glow Stock selection is one of the most critical aspects for equity fund managers, since that is the point where they are supposed to deliver so-called alpha as value added from active management and therefore the justification for their management fee. I have had a number of meetings with portfolio managers over the past 20 years, and most of them told me they try to find high-quality stocks. That said, one can imagine the quality of a stock is defined differently by each manager. Asked how they evaluate quality, most managers told me they have implied quantitative screens for financial data, and they meet with the management of companies to verify future expectations of the companies’ operation. But few of the fund managers told me they use environmental, social, or governance (ESG) criteria for stock selection. Nevertheless, nowadays a number of portfolio managers employ at least one ESG criterion in their screening process. This shows that the integration of ESG criteria has gained ground in the conventional asset management industry. From my point of view it is not surprising that even conventional fund managers have started to use ESG criteria, since these data deliver a unique view of a company that is not dependent on financial data. Fund managers who employ ESG data and criteria in their selection process have an opportunity to gain a competitive edge through the use of information that is not used by their competitors. But, what information can be gathered from ESG criteria? Using ESG criteria the research process should lead to companies that have good policies on environmental and social aspects and a strong management that follows best-practice guidelines and has no conflicts of interest. In more detail ESG data can be used to identify so-called corporate-specific risks, i.e., the risk of fatalities, outages, fraud, or strikes as well as macro risks such as labor intensity or a shortage of skills, weather impacts, data protection, security issues, or possible water shortages. From my perspective the lack of education is a key factor of why ESG criteria will not be used widely in the asset management industry in the short term. But, with the turnover in staff and the educational efforts by industry associations and promoters of advanced education courses, the use of ESG criteria will become more popular over time. There is evidence that investors from Generations X and Y are more demanding with regard to information about how their money is invested. In addition, surveys have shown that investors from these generations are also more tuned to a lifestyle of health and sustainability and want to invest their money in funds that have similar goals in place. This means the demand from investors for products using a sustainable investment approach should increase, since Generations X and Y have just started to become investors. From my point of view this demand will be the main driver for a change in thinking and acting within the wider asset-management industry. Early adaptors might be the winners in this trend, since they can build up a reputation as thought leaders, along with a performance track record, prior to their competitors. The views expressed are the views of the author, not necessarily those of Thomson Reuters.
Facts, Opinions, And Risk Management

Editor’s note: Originally published at tsi-blog.com on August 14, 2015. Commentators on the financial markets often make statements like “it’s a bull market” and “the trend is up” as if these were indisputable facts, but such statements are always opinions. A statement of fact could reasonably be phrased along the lines of “the market was in an upward trend between date X and date Y,” because if a sequence of rising lows and rising highs occurred between two dates then the trend was, by definition, up during that period. However, it is impossible to know the direction of a market’s current price trend with absolute certainty, let alone the direction of its future price trend. The reason is that even if a market has just made a new high/low, there will be some chance that this will turn out to be the ultimate high/low. For example, it’s a fact that gold was in a bear market in US$ terms from its peak in September of 2011 through to 24th July 2015 (when it hit a 4-year low of $1072), but it is a matter of opinion as to whether gold is now in a bear market. The bear market could obviously still be in progress, but there is also a possibility that it ended on 24th July 2015. At the time of writing, nobody knows for sure. Some market participants and commentators will draw a line on a chart and then make a statement such as “I will consider the trend to be up (or down) unless the market proves otherwise by moving below (or above) my line”. Fine, but there’s a big difference between claiming to know the direction of the price trend and working under the assumption that the trend is in a particular direction unless/until proven otherwise by some predetermined event. The valley of shattered financial dreams is littered with traders who were determined to stay ‘long’ or ‘short’ because they thought they KNEW the direction of the price trend. The impossibility of knowing whether a bull/bear market or an up/down trend is going to continue, or even whether the market is currently in bull or bear mode, makes risk management essential. Someone who knew the future would never have to bother with risk management; they could, instead, risk everything on a particular outcome because for them it wouldn’t be a risk at all. But ordinary mortals always face a degree of uncertainty when making investment decisions and, as a result, always need to face the reality that these decisions could prove to be wrong. Be wary, then, of advisors who claim that there is only one possible direction for the future price of an investment. But while unwillingness to acknowledge the possibility of being wrong is a defect in the approach of some investors, other investors suffer from the opposite problem in that they have a hard time maintaining a bullish or bearish view unless that view is continually being validated by the price action. That is, they are incapable of remaining confident in any opinion that doesn’t happen to conform to the current opinion of the manic-depressive mob. As a result, they routinely get ‘sucked in’ following large price rises and ‘blown out’ following large price declines, as opposed to taking advantage of the mob’s proclivity to be wrong. Therefore, as investors, the challenge we all face is to strike a balance between staying the course in rough weather and preparing ourselves for the possibility that there could be unseen rocks up ahead.

Structured Notes: Read The Fine Print

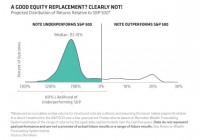
By Seth J. Masters, Richard Weaver, John McLaughlin Structured notes have gained in popularity, but investors would be wise to read the fine print carefully. Our research indicates that these complex instruments rarely live up to their intriguing claims. Nearly $13 billion of structured notes were sold by banks in the first quarter of 2015-more than in any quarter since early 2011. It’s easy to see why. Who wouldn’t like to participate in the equity market’s upside, while protecting their portfolio from potential losses? Unfortunately, our research shows that structured notes seldom deliver the promising outcomes touted in their bold headlines. Structured notes come in many flavors, and we analyzed the claims of several of the more popular varieties. Our analysis found that an oversimplified pitch typically obscures key constraints that adversely impact the investor’s likely final payout. Give with the Left, Take with the Right Consider a recent five-year structured note tied to the broad market that promises the price return of the S&P 500 Index but no loss on the first 28% cumulative drop. Buried in the disclosure are important caveats, including the lack of dividends or yield, plus a five-year waiting period for any distributions. Those who skip the fine print might be tempted to consider this note as a potential replacement for direct stock exposure. In our view, that would be a mistake. Our analysis suggests that this structured note has an 80% chance of underperforming the S&P 500 over the next five years-and by no small amount. Using our Capital Markets Engine, we estimate the median return that investors would forego at just over 12%, as the Display below shows.  A closer look under the hood reveals why. To achieve the optimal balance between upside and downside, banks package a zero-coupon bond with options on the S&P 500. In addition to markups on the embedded bond and options, there’s a healthy sales commission, all of which reduce investors’ return potential. Tying the note to the S&P 500’s price return-as opposed to the total return you’d receive through an S&P 500 index fund or ETF-is another drawback. The index fund includes dividends, which have historically been a meaningful portion of the broad market’s overall gains. Missing out on dividends for five years puts the note at a distinct disadvantage. It explains the lion’s share of the performance gap. Settling for Less Given the structured note’s mix of growth and protection, some might consider a balanced portfolio that includes globally diversified equities, municipal bonds and other diversifiers a more relevant comparison. Here again, the structured note falls short. Projecting thousands of plausible outcomes across all types of market environments, we found that the median outcome for the structured note is more than 6% below what we’d expect from a fully diversified balanced portfolio, as the next Display shows. Given the sales pitch, you might expect the structured note to do better if the S&P 500 price declines over five years. Not so! In down markets, the structured note would protect you from losses up to 28%, but your expected return would be zero. By comparison, we forecast that a balanced portfolio that includes bonds and other diversifiers would have an expected return of 4.5%, with better downside protection from a deeper market drop. That’s because the income from bonds-along with their tendency to move in the opposite direction from equities-can help offset the losses from stocks, while alternatives act as a further diversifier. In short, if investors are willing to accept no return, they are setting the bar too low. For most investors, an income-generating balanced portfolio that is both liquid and likelier to outperform represents a much better solution. When it comes to structured notes, investors need to make sure they’re getting the full picture from their provider. The views expressed herein do not constitute research, investment advice or trade recommendations and do not necessarily represent the views of all AB portfolio-management teams. The Bernstein Wealth Forecasting System uses a Monte Carlo model that simulates 10,000 plausible paths of return for each asset class and inflation and produces a probability distribution of outcomes. The model does not draw randomly from a set of historical returns to produce estimates for the future. Instead, the forecasts (1) are based on the building blocks of asset returns, such as inflation, yields, yield spreads, stock earnings and price multiples; (2) incorporate the linkages that exist among the returns of various asset classes; (3) take into account current market conditions at the beginning of the analysis; and (4) factor in a reasonable degree of randomness and unpredictability.