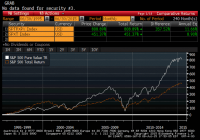
In a series of articles in December 2014, I highlighted five buy-and-hold strategies that have historically outperformed the S&P 500 (SPY). Stock ownership by U.S. households is low and falling even as the barriers to entering the market have been greatly reduced. Investors should understand simple and easy to implement strategies that have been shown to outperform the market over long time intervals. The second of five strategies I will revisit in this series of articles is the “value factor” that has seen stocks with these characteristics outperform the broader market. In a series of articles in December 2014, I demonstrated five buy-and-hold strategies – size, value, low volatility, dividend growth, and equal weighting, that have historically outperformed the S&P 500 (NYSEARCA: SPY ). I covered an update to the size factor published on Wednesday. In that series, I demonstrated that while technological barriers and costs to market access have been falling, the number of households that own stocks in non-retirement accounts has been falling as well. Less that 14% of U.S. households directly own stocks, which is less than half of the amount of households that own dogs or cats , and less than half of the proportion of households that own guns . The percentage of households that directly own stocks is even less than the percentage of households that have Netflix or Hulu . The strategies I discussed in this series are low cost ways of getting broadly diversified domestic equity exposure with factor tilts that have generated long-run structural alpha. I want to keep these investor topics in front of the Seeking Alpha readership, so I will re-visit these principles with a discussion of the first half returns of these strategies in a series of five articles over the next five days. Reprisals of these articles will allow me to continually update the long-run returns of these strategies for the readership. Value In the first article in this series, I described the “size factor”, or why small-cap stocks tend to outperform large-cap stocks over long time intervals. The size factor is captured in the Fama-French Three Factor Model that helped earn Eugene Fama the Nobel Prize in Economics in 2013. Another of these factors is the “value factor.” The researchers noted that low market-to-book stocks tended to outperform high market-book stocks. Adding the “size factor” and value factor” to the Capital Asset Pricing Model better describes the stock market performance than beta alone. Since we are trying to beat the general market, it makes intuitive sense that alpha would be found in a value factor that was used as a supplement to better describe overall returns. Our second way to beat the market, as proxied by the S&P 500, is then to simply buy value stocks. Below I have tabled the average returns of the S&P 500 Pure Value Index, and show the returns of this index graphed against the S&P 500. For more information on this style-concentrated index, please see the linked microsite . This index is replicated through the Guggenheim S&P 500 Pure Value ETF (NYSEARCA: RPV ) with an expense ratio of 0.35%. The S&P 500 Pure Value Index identifies constituents by measures of high levels of book value, earnings, and sales to the share price. In the five strategies I am detailing to “beat the market”, I will be using trailing 20 years of data, which is the longest time interval that encapsulated all of the relevant indices used in the analysis. (click to enlarge) Source: Bloomberg; Standard and Poor’s Source: Bloomberg; Standard and Poor’s Why has value investing worked historically? Why has the S&P 500 Pure Value Index outperformed over this long sample period? Value investing has been extolled since the days of Benjamin Graham, and put into most visible practice by his pupil, Warren Buffett. Value investing necessitates understanding the difference between a stock that is valued too low by the market, and a stock that is a “value trap” because changes in the business or its industry have created a structural headwind. Value investors then need to have the fortitude to hold their investment when investor sentiment runs counter to their investment themes. On average, individual investors do not have these attributes. In data from “How America Saves”, the fund giant Vanguard has published a wealth of data on defined contribution plans under its management. The table below shows participant contributions in Vanguard’s defined contribution plans over the trailing ten years. Investors should on average be taking a long-term view towards their retirement assets; however, investors owned their lowest percentage of equities in 2009 as markets rebounded from the 2008 downturn, missing a 26.5% total return for the S&P 500 and a tremendous 55.2% return for the S&P 500 Pure Value Index. Source: Vanguard – an updated version of their analysis is linked . In the four years that the S&P 500 produced a negative return in our twenty-year dataset, the value index produced a higher return in the following year. In the Vanguard data, retirement plan participants, who should be taking a long-term view towards their investments, were less likely to own equities after 2008. Value investing is a discipline, and the average investor is not suited to follow this approach, which may be why a low-cost, rules-based exchange-traded fund with a value bent like may be a good solution for some investors. While a value-based strategy has historically outperformed, you can see from the data table below that the value-based index lagged in the first half of 2015. Source: Bloomberg, Standard and Poor’s This 249bp first half underperformance relative to the S&P 500 was the last first half underperformance since 2012. In that year, value stocks rebounded by generating a nearly 18% return in the second half versus a 6% return for the broader market. Value stocks have only produced negative returns over the first six months of four calendar years in the dataset, 1994, 2000, 2008, and 2015. Two of those periods (2000 and 2008) preceded economic recessions and one year 1994 – featured sharply higher interest rates. As I wrote in my 10 Themes Shaping Markets in the Back Half of 2015 , with stock prices near all-time highs and bond prices still elevated from low interest rates despite the first half sell-off, forward returns in asset markets will continue to be subnormal. For long-term investors with a buy-and-hold approach, the value factor has generated alpha over long-time intervals. I will be publishing updated results for three additional proven buy-and-hold strategies that can be replicated through low cost indices over the next three days. Disclaimer My articles may contain statements and projections that are forward-looking in nature, and therefore inherently subject to numerous risks, uncertainties and assumptions. While my articles focus on generating long-term risk-adjusted returns, investment decisions necessarily involve the risk of loss of principal. Individual investor circumstances vary significantly, and information gleaned from my articles should be applied to your own unique investment situation, objectives, risk tolerance, and investment horizon. Disclosure: I am/we are long SPY. (More…) I wrote this article myself, and it expresses my own opinions. I am not receiving compensation for it (other than from Seeking Alpha). I have no business relationship with any company whose stock is mentioned in this article.


