Tag Archives: performance

RWX: Not My First Choice For International Real Estate

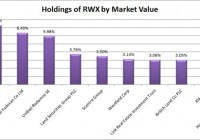
Summary RWX has too much volatility and correlation to the S&P 500. The dividend yields aren’t bad, but they aren’t great enough to justify the investment. The high expense ratio hammers home my view that this just is not an attractive way to do international investing. Investors should be seeking to improve their risk adjusted returns. I’m a big fan of using ETFs to achieve risk adjusted returns relative to the portfolios that normal investors can generate for themselves after trading costs. A substantial portion of my analysis will use modern portfolio theory, so my goal is to find ways to minimize costs while achieving diversification to reduce the total portfolio risk level. In this article, I’m reviewing the SPDR Dow Jones International Real Estate ETF (NYSEARCA: RWX ). What does RWX do? RWX attempts to track the investment results of the Dow Jones Global ex-U.S. Select Real Estate Securities Index. The ETF falls under the category of “Global Real Estate”. Does RWX provide diversification benefits to a portfolio? Each investor may hold a different portfolio, but I use the SPDR S&P 500 Trust ETF (NYSEARCA: SPY ) as the basis for my analysis. I believe SPY, or another large cap U.S. fund with similar properties, represents the reasonable first step for many investors designing an ETF portfolio. Therefore, I start my diversification analysis by seeing how it works with SPY. The correlation is about 84%, which is high enough that RWX does not offer the level of diversification benefits that I would like to see. Standard deviation of monthly returns (dividend adjusted, measured since January 2007) The standard deviation isn’t going to make a strong case for investing in RWX. For the period I’ve chosen, the standard deviation of monthly returns is 142% of the deviation for the S&P 500. Due to the combination of volatility and correlation, it is not viable to use RWX as a way to reduce the portfolio risk if the major holding in the portfolio is SPY or another major domestic equity ETF since most major domestic equity ETFs have extremely high correlations to SPY themselves. I don’t believe historical returns have predictive power for future returns, but I do believe historical values for standard deviation of returns relative to other ETFs have some predictive power on future risks and correlations. Yield The distribution yield is 3.03%. This may be one of the strongest areas for the ETF, but investors can find similar levels of yield on domestic equity REIT ETF investments with lower levels of risk. Expense Ratio The ETF is posting 0.59% for an expense ratio. Since I focus on buying ETFs with expense ratios below 0.10%, the costs on this investment are way above my comfortable threshold. However, the overall international REIT ETF sector has high expense ratios. Market to NAV The ETF is trading at a 0.21% premium to NAV currently. I think any ETF is significantly less attractive when it trades above NAV. The premium to NAV is a little surprising since the trading volume (over 600,000) should be enough to mitigate any meaningful deviation from NAV. On the other hand, when I look at the average monthly premium/discount to NAV, I see that over the last year the ETF has often bounced between trading at premiums and discounts to NAV. The most notable period was October of 2014 when the ETF averaged a premium of nearly 1.5% to book value. Largest Holdings The diversification within the ETF is pretty weak as demonstrated by my chart of the top holdings. (click to enlarge) Despite the large positions in a few of the holdings, doing individual due diligence on each investment would be fairly difficult. Investors buying into the international REIT ETF will need to rely on markets being at least somewhat efficient. Allocation by Country The following chart breaks down the holdings by country. (click to enlarge) When it comes to international diversification, I’m fairly happy with the way the portfolio is set up. For it being a real international fund, I would prefer some exposure to Africa and South America in the portfolio, but on the whole, diversification is fairly solid. It is a pet peeve for me when funds label themselves as international and then put 40% to 70% of the portfolio in a single foreign country. Conclusion In my opinion, it is difficult to make a solid argument for the use of the SPDR Dow Jones International Real Estate ETF under modern portfolio theory. The high level of volatility combined with the high correlation leaves investors requiring a higher expected level of return on the investment. I don’t see that as a likely result when the ETF is charging a high expense ratio. The holdings would have to significantly outperform the S&P 500 over the long term to provide enough returns to compensate investors for the additional risk. On top of the higher level of returns, the ETF also has to be able to cover the higher expense ratios. In short, I’m just not seeing a compelling long-term option for inclusion in my portfolio. Disclosure: I/we have no positions in any stocks mentioned, and no plans to initiate any positions within the next 72 hours. (More…) I wrote this article myself, and it expresses my own opinions. I am not receiving compensation for it (other than from Seeking Alpha). I have no business relationship with any company whose stock is mentioned in this article. Additional disclosure: Information in this article represents the opinion of the analyst. All statements are represented as opinions, rather than facts, and should not be construed as advice to buy or sell a security. Ratings of “outperform” and “underperform” reflect the analyst’s estimation of a divergence between the market value for a security and the price that would be appropriate given the potential for risks and returns relative to other securities. The analyst does not know your particular objectives for returns or constraints upon investing. All investors are encouraged to do their own research before making any investment decision. Information is regularly obtained from Yahoo Finance, Google Finance, and SEC Database. If Yahoo, Google, or the SEC database contained faulty or old information it could be incorporated into my analysis.
The Vanguard Short-Term Bond ETF Is A Great Replacement For Cash

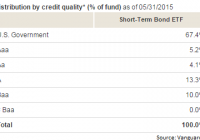
Summary The Vanguard Short-Term Bond ETF delivers excellent diversification benefits relative to the equity market without being as miserable as a savings account. The bonds in the Vanguard Short-Term Bond ETF are focused on very high credit quality but there is a small selection of lower rated bonds to enhance returns. The Vanguard Short-Term Bond ETF bond selections contain some diversification in maturity to give investors a focus on short term investments without giving up on yield. The Vanguard Short-Term Bond ETF (NYSEARCA: BSV ) is a solid bond fund for the very conservative investor that wants a place to park while earning a better return than a savings account will offer. Lately I’ve been concerned about the market being relatively highly valued. I don’t intend to retire for quite a while (measured in decades), so I’m willing to be more aggressive with my portfolio. Despite being willing to accept additional risk on my portfolio, I want to be compensated for taking risk. While I still like certain parts of the market (as shown by buying diversified REIT ETFs), I’m looking for ways to get better diversification in the portfolio. The desire for better diversification across asset classes has pushed me to make a few hard decisions. For instance, it is pushing me to slow my rate of purchases on additional equity so I can have more money on hand to buy in if we see a significant retreat in equity prices. Those expectations and desires bring to me look for some solid bond ETFs so I can at least get a little interest on the money that I would otherwise have to hold in cash. Low volatility and low correlation with the domestic stock market are major concerns, but I also want something with reasonable liquidity and low expense ratios. When the yields on bonds are terrible, and I believe that is a fair statement today, a high expense ratio would eat a substantial portion of the returns. In this case, the expense ratio is only .10%. It is in my nature to be cheap and I have to admit, that .10% sounds fair to me. It thoroughly beats many bond funds on expense ratio. How volatile is the Vanguard Short-Term Bond ETF? I started by checking for correlation with the SPDR S&P 500 Trust ETF (NYSEARCA: SPY ) by comparing the monthly changes in dividend adjusted closes over the last 8 years. The correlation was 3.34%, which is beautiful. By virtually any measure, incorporating BSV into a portfolio is going to materially reduce the risk of the portfolio. While SPY had a standard deviation of 4.6% in monthly returns, BSV only had a deviation of .777%. Low correlation and low volatility is exactly what we should expect for a fund invested in short-term high quality bonds, but it is always worth double checking. Sources of Return With the returns on short term maturities being very low, investors should consider having at least a little bit of credit risk or duration in their portfolio even if they want to focus on short term holdings. I checked both of those areas to see how the Vanguard Short-Term Bond ETF was doing on internal diversification. Credit The following chart shows the credit quality breakdown: In my opinion, this is a fairly reasonable allocation for an ETF that an investor might want to use as a substitute for cash in their portfolio if they expect to be holding that cash for a few months at a time. The ETF portfolio drops down to ratings as low as Baa but keeps the majority of their holdings in very high credit quality bonds. Maturity The next chart shows the maturity of the various bonds Again the maturity distribution looks good for short term holdings. By dividing the holdings between the different maturities rather than focusing them around a specific point there is more diversification across the short term yield curves which should produce a slight decrease in the expected level of volatility for the expected level of income. A Potential Cash Replacement Looking at the monthly returns over 8 years, I found there was only one month where the change in the dividend adjusted close was equal to 2% or greater. In that one month, it was precisely at 2%. Due to the positive returns from interest and low levels of duration and credit and risk the downside risk is fairly low. Of course, if an investor is using it as a replacement for cash they’ll need to use a brokerage that lets them buy and sell it with no commissions. Conclusion I like the portfolio for the Vanguard Short-Term Bond ETF. The yields are still weak, but that is an issue with high quality short term yields being very low rather than a problem with the underlying ETF. Given the low risk of the bond ETF, I like this fund as a source of diversification in the portfolio. It’s too bad free trading on the ETF is not more widely available, because this looks like a solid place to park cash when the market gets too rich or when investors are just looking for new options. The combination of a small amount of duration with a little credit risk makes this option more appealing to me than a fund that refused to take on any risk in those categories. Disclosure: I/we have no positions in any stocks mentioned, and no plans to initiate any positions within the next 72 hours. (More…) I wrote this article myself, and it expresses my own opinions. I am not receiving compensation for it (other than from Seeking Alpha). I have no business relationship with any company whose stock is mentioned in this article. Additional disclosure: Information in this article represents the opinion of the analyst. All statements are represented as opinions, rather than facts, and should not be construed as advice to buy or sell a security. Ratings of “outperform” and “underperform” reflect the analyst’s estimation of a divergence between the market value for a security and the price that would be appropriate given the potential for risks and returns relative to other securities. The analyst does not know your particular objectives for returns or constraints upon investing. All investors are encouraged to do their own research before making any investment decision. Information is regularly obtained from Yahoo Finance, Google Finance, and SEC Database. If Yahoo, Google, or the SEC database contained faulty or old information it could be incorporated into my analysis.

Why EPS And Share Price Don’t Predict Future Performance

Most analysts, and especially “chartists,” put a lot of emphasis on earnings per share (EPS) and stock price movements when determining whether to buy a stock. Unfortunately, these are not good predictors of company performance, and investors should beware. Most analysts are focused on short-term – meaning quarter-to-quarter – performance. Their idea of long term is looking back 1 year, comparing this quarter to the same quarter last year. As a result, they fixate on how EPS has done and will talk about whether improvements in EPS will cause the “multiple” (meaning stock price divided by EPS) to “expand.” They forecast stock price based upon future EPS times the industry multiple. If EPS is growing, they expect the stock to trade at the industry multiple, or possibly somewhat better. Grow EPS, hope to grow the multiple, and project a higher valuation. Analysts will also discuss the “momentum” (meaning direction and volume) of a stock. They look at charts, usually less than one year, and if price is going up, they will say the momentum is good for a higher price. They determine the “strength of momentum” by looking at trading volume. Movements up or down on high volume are considered more meaningful than those on low volume. But unfortunately, these indicators are purely short-term, and are easily manipulated so that they do not reflect the actual performance of the company. At any given time, a CEO can decide to sell assets and use that cash to buy shares. For example, McDonald’s (NYSE: MCD ) sold Chipotle and Boston Market. Then, the leadership took a big chunk of that money and repurchased company shares. That meant McDonald’s took its two fastest-growing and highest-value assets and sold them for short-term cash. They traded growth for cash. Then leadership spent that cash to buy shares, rather than invest in another growth vehicle. This is where short-term manipulation happens. Say a company is earning $1,000 and has 1,000 shares outstanding – so its EPS is $1. The industry multiple is 10, so the share price is $10. The company sells assets for $1,000 (for the purpose of this exercise, let’s assume the book value on those assets is $1,000 – so there is no gain, no earnings impact and no tax impact.) Company leadership says its shares are undervalued, so to help out shareholders it will “return the money to shareholders via a share repurchase” (Note, it is not giving money to shareholders, just buying shares.) $1,000 buys 100 shares. The number of shares outstanding now falls to 900. Earnings are still $1,000 (flat, no gain), but dividing $1,000 by 900 now creates an EPS of $1.11 – a greater than 10% gain! Using the same industry multiple, analysts now say the stock is worth $1.11 x 10 = $11.10! Even though the company is smaller has weaker growth prospects, somehow this “refocusing” of the company on its “core” business and cutting extraneous noise (and growth opportunities) has led to a price increase. Worse, the company hires a very good investment banker to manage this share repurchase. The investment banker watches stock buys and sells, and any time he sees the stock starting to soften, he jumps in and buys some shares so that momentum remains strong. As time goes by and the repurchase program is not completed, he will selectively make large purchases on light trading days, thus adding to the stock’s price momentum. The analysts look at these momentum indicators, now driven by the share repurchase program, and deem the momentum to be strong. “Investors love the stock”, the analysts say (even though the marginal investors making the momentum strong are really company management), and start recommending to investors that they should anticipate this company achieving a multiple of 11 based on earnings and stock momentum. The price now goes to $1.11 x 11 = $12.21. Yet, the underlying company is no stronger. In fact, one could make the case it is weaker. But due to the higher EPS, better multiples and higher share price, the CEO and her team are rewarded with outsized multi-million dollar bonuses. But over the last several years companies did not even have to sell assets to undertake this kind of manipulation. They could just spend cash from earnings. Earnings have been at record highs – and growing – for several years. Yet, most company leaders have not reinvested those earnings in plant, equipment or even people to drive further growth. Instead, they have built huge cash hoards , and then spent that cash on share buybacks, creating the EPS/multiple expansion – and higher valuations – described above. This has been so successful that in the last quarter, untethered corporations have spent $238B on buybacks, while earning only $228B . The short-term benefits are like corporate crack, and companies are spending all the money they have on buybacks rather than reinvesting in growth. Where does the extra money originate? Many companies have borrowed money to undertake buybacks. Corporate interest rates have been at generational (if not multi-generational) lows for several years. Interest rates were kept low by the Federal Reserve hoping to spur borrowing and reinvestment in new products, plant, etc. to drive economic growth, more jobs and higher wages. The goal was to encourage companies to take on more debt, and its associated risk, in order to generate higher future revenues. Many companies have chosen to borrow money, but rather than investing in growth projects, they have bought shares. They borrow money at 2-3%, then buy shares – which can have a much higher immediate impact on valuation – and drive up executive compensation. This has been wildly prevalent. Since the Fed started its low-interest policy, it has added $2.37 trillion in cash to the economy. Corporate buybacks have totaled $2.41 trillion. This is why a company can actually have a crummy business and look ill-positioned for the future, yet have growing EPS and stock price. For example, McDonald’s has gone through rounds of store closures since 2005, sold major assets, now has more stores closing than opening and has its largest franchisees despondent over future prospects . Yet, the stock has tripled since 2005! Leadership has greatly weakened the company and put it into a growth stall (since 2012), and yet, its value has gone up! Microsoft (NASDAQ: MSFT ) has seen its “core” PC market shrink, had terrible new product launches of Vista and Windows 8, wholly failed to succeed with a successful mobile device, has written off billions in failed acquisitions, and consistently lost money in its gaming division. Yet, in the last 10 years, it has seen EPS grow and its share price double through the power of share buybacks from its enormous cash hoard and ability to grow debt. While it is undoubtedly true that 10 years ago Microsoft was far stronger as a PC monopolist than it is today, its value today is now higher. Share buybacks can go on for several years. Especially in big companies. But they add no value to a company, and if not exceeded by re-investments in growth markets, they weaken the company. Long term, a company’s value will relate to its ability to grow revenues and real profits. If a company does not have a viable, competitive business model with real revenue growth prospects, it cannot survive. Look no further than HP (NYSE: HPQ ), which has had massive buybacks, but is today worth only what it was worth 10 years ago as it prepares to split. Or Sears Holdings (NASDAQ: SHLD ), which is now worth 15% of its value a decade ago. Short-term manipulative actions can fool any investor and keep stock prices artificially high, so make sure you understand the long-term revenue trends and prospects of any investment, regardless of analyst recommendations.