Balanced Portfolio By Age: How To Find Your Perfect Portfolio
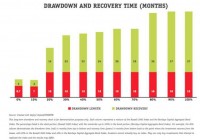
Does having a balanced portfolio by age lead to a desired portfolio? We have the answer for you. The question of optimum portfolio mixture based on your age comes up frequently. The general concept seems to be that the older we are, the more conservative we have to be because we do not have as long to recover from losses. On average, a 20 year-old has a lot longer to recover from a market downturn than an 80 year-old. We have done some research on how long it took to recover from major downturns with different stock and bond mixtures. What many may find surprising is how similar the recovery time has been for the different portfolio mixtures. See “How to Make an Investment Portfolio: 6 Steps to Better Investing” for a description of portfolio design. Balanced Portfolio by Age – Drawdown and Recovery To represent the stock market, we used the Russell 3000 Index, which makes up a majority of the United States stock market. We used the Barclays Capital Aggregate Bond Index to represent the bond market, which makes up most of the United States bond market. The chart shows the worst time frame (max drawdown) for each mixture from January 1979 to September 2013. Each column shows the percentage in Russell 3000 Index. The unstated remaining portion is the amount in the Barclays Capital Aggregate Bond Index. The chart below shows how long in months each mixture dropped. This is shown in red. Then how many months it took to recover, which is shown in green. Investors can add both the drawdown months and the recovery months to figure out how long it would take to get back to where they started in each of these portfolios. For example, the 70% mixture, which is 70% Russell 3000 Index and 30% Barclays Capital Aggregate Bond Index, fell for 16 months and then took 26 months to recover, which means your investment would have taken 42 months (16 down+26 up) to fully recover during the worst fall, for this mixture, since January 1979. See “Best Method to Evaluate Investment Risk” for complete information on how to evaluate the risk of your portfolio. (click to enlarge) What conclusions can we draw from this research? First, the future may not be like the past, although since we do not have a crystal ball or a time machine, looking back is often the best tool we have available. Next, we find the most interesting portion of this research was to discover how many of the portfolios were so similar in terms of total recovery time. Historically, there were three main groupings: 0 to 10% stock 30 to 70% stock 80 to 100% stock In each one of these groupings, you almost had the same total recovery time. It would seem to make sense to take the higher stock percentage portfolio in each grouping because over a longer period of time, the more stock in the portfolio the more total return. Balance Portfolio by Age – More Stock Market Exposure Equals More Money Over The Long-Term You can see that relationship between more stock market exposure and more money in this next chart, which shows the value of each of the above portfolio if you invested $100,000 in January 1979. Most investors do not think about investing for the next 35 years, but looking at long-term data can be useful because they capture more market cycles. This chart shows a perfect long-term correlation between more stock market exposure and more money. On average, the more stock market exposure you have the more you make. See “The 5 Pillars of Effective Asset Management” for a series of articles on how to maximize your returns. (click to enlarge) For example, you can see historically, it would have been much better to take the 70% stock portfolio than the 30% stock portfolio, especially when you consider the total recovery time was only four months longer for the 70% stock portfolio during the worst time period for each portfolio. Balance Portfolio by Age – Finding Your Personal Risk Tolerance There is a catch. Each person has to consider age, especially when considering how long it will take your portfolio to recover, but more importantly you need to consider personal risk tolerance. How much risk can you take before you panic and sell? This chart shows the low value for a $100,000 investment made just before the max drawdown started in each of the above mixtures. This effectively shows what would have happened if you invested $100,000 in each of the above portfolios just before the worst downturn for each of these portfolios. This chart shows you what your worst monthly statement would have been before it finally recovered many months later. (click to enlarge) As you can see, there is a fairly significant difference in the low value between the 30% stock portfolio and the 70% stock portfolio. Incredibly, even with that difference it only took four months longer for the 70% portfolio to recover, but if the account fell more than you could tolerate, you’re never going to see that recovery. The most important part of finding a balanced portfolio by age is finding your personal risk tolerance at your current age. Examine the historical maximum drawdown periods for the portfolio mixtures you are considering. See how much you can lose and how long it takes to recover. Lastly, see how much you might make. This full examination of the possibilities will help you determine the perfect portfolio for your age.
