Tag Archives: past

5 Large-Cap Blend Funds For Growth And Value Investing

Blend funds are a type of equity mutual fund which holds in its portfolio a mix of value and growth stocks. Blend funds are also known as “hybrid funds”. Blend funds aim for value appreciation by capital gains. It owes its origin to a graphical representation of a fund’s equity style box. In addition to diversification, blend funds are great picks for investors looking for a mix of growth and value investment. Meanwhile, large-cap funds usually provide a safer option for risk-averse investors, when compared to small-cap and mid-cap funds. These funds have exposure to large-cap stocks, providing long-term performance history and assuring more stability than what mid-cap or small-caps offer. Below we will share with you 5 buy-ranked large-cap blend mutual funds. Each has earned a Zacks Mutual Fund Rank #2 (Buy) as we expect these mutual funds to outperform their peers in the future. Deutsche Core Equity S (MUTF: SCDGX ) seeks capital appreciation along with current income and income growth. A lion’s share of its assets is invested in equities or mostly in common stocks. SCDGX invests mostly in large US firms, but is not restricted by market capitalization limitations. The Deutsche Core Equity S fund has returned 13.6% over the past one year. SCDGX has an expense ratio of 0.59% as compared to category average of 1.04%. PNC Large Cap Core C (MUTF: PLECX ) invests in broad range of US equities of large-cap firms, including American Depositary Receipts, preferred stocks, warrants and rights. A lion’s share of PLECX’s assets is invested in firms with at least $3 billion worth of market cap. The PNC Large Cap Core C fund has returned 12.5% over the past one year. Douglas J. Roman is the fund manager and has managed PLECX since 2009. Northern Large Cap Equity (MUTF: NOGEX ) seeks to provide long-term capital appreciation. NOGEX invests a majority of its assets in large-cap firms. These companies will have a market capital, at the time of purchase, within the range of those listed in the S&P 500 Index. Northern Large Cap Equity fund has returned 10.3% over the past one year. As of June 2015, NOGEX held 57 issues, with 5.21% of its total assets invested in Apple Inc (NASDAQ: AAPL ). JPMorgan US Equity R5 (MUTF: JUSRX ) aims to provide high total return. JUSRX invests a lion’s share of its assets in domestic companies. JUSRX mostly invests in common stocks of mid-to-large-cap domestic firms. It may also invest a maximum of 20% of its assets in foreign companies. JPMorgan US Equity R5 fund has returned 10.2% over the past one year. JUSRX has an expense ratio of 0.59% as compared to category average of 1.04% Vanguard Growth & Income Investor (MUTF: VQNPX ) invests in a diversified group of stocks chosen with the help of sophisticated computer models. VQNPX seeks stocks that appear to be undervalued by the market and that, as a group, appear likely to provide higher returns than the unmanaged Standard & Poor’s 500 Composite Stock Price Index while having similar risk characteristics. Vanguard Growth & Income Investor has returned 9.9% over the past one year. Philip W. Kearns is the fund manager and has managed VQNPX since 2014. Original Post
Best And Worst: Large Cap Value ETFs, Mutual Funds And Key Holdings

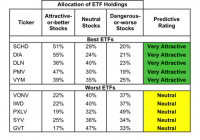
Summary Large Cap Value style ranks first in Q2’15. Based on an aggregation of ratings of 42 ETFs and 920 mutual funds. SCHD is our top rated Large Cap Value ETF and CDOYX is our top rated Large Cap Value mutual fund. The Large Cap Value style ranks first out of the 12 fund styles as detailed in our Q2’15 Style Ratings report. It gets our Attractive rating, which is based on aggregation of ratings of 42 ETFs and 920 mutual funds in the Large Cap Value style. Figures 1 and 2 show the five best and worst rated ETFs and mutual funds in the style. Not all Large Cap Value style ETFs and mutual funds are created the same. The number of holdings varies widely (from 15 to 1003). This variation creates drastically different investment implications and, therefore, ratings. Investors seeking exposure to the Large Cap Value style should buy one of the Attractive-or-better rated ETFs or mutual funds from Figures 1 and 2. Figure 1: ETFs with the Best & Worst Ratings – Top 5 (click to enlarge) * Best ETFs exclude ETFs with TNAs less than $100 million for inadequate liquidity. The iShares Enhanced U.S. Large Cap ETF (NYSEARCA: IELG ) and The First Trust NASDAQ Rising Dividend Achievement ETF (NASDAQ: RDVY ) are excluded from Figure 1 because their total net assets are less than $100 million and do not meet our liquidity minimums. Figure 2: Mutual Funds with the Best & Worst Ratings – Top 5 (click to enlarge) * Best mutual funds exclude funds with TNAs less than $100 million for inadequate liquidity. The Schwab U.S. Dividend Equity ETF (NYSEARCA: SCHD ) is our top-rated Large Cap Value ETF and the Columbia Funds Dividend Opportunity Fund (MUTF: CDOYX ) is our top-rated Large Cap Value Mutual Fund. Both earn our Very Attractive rating. One of our favorite stocks held by Large Cap Value funds is Travelers Companies (NYSE: TRV ). Since 2008, Travelers has grown after tax profit ( NOPAT ) by 5% compounded annually. More recently, the company has ramped up its NOPAT growth, growing profits by 51% compounded annually since 2011. The company currently has a 12% return on invested capital ( ROIC ), over $3.4 billion in free cash flow on a trailing 12-month basis, and positive economic earnings for eight of the past 10 years. However, at its current price of ~$101/share, Travelers is significantly undervalued, with a price to economic book value ( PEBV ) ratio of 0.6. This ratio implies the market expects Travelers’ profits to permanently decline by 40% from current levels, despite the fact that the most recent results show Travelers doing the exact opposite, growing profits by over 50%. If Travelers can grow NOPAT by just 5% compounded annually for the next seven years , the stock is worth $200/share today – a 98% upside. The Columbia American Beacon Large Cap Value ETF (NYSEARCA: GVT ) is our worst rated Large Cap Value ETF and the Good Harbor Tactical Equity Income Fund (MUTF: GHTAX ) is our worst rated Large Cap Value mutual fund. GVT earns our Neutral rating and GHTAX earns our Very Dangerous rating. One of the worst stocks held by Large Cap Value funds is Williams Companies (NYSE: WMB ). Since 2011, the company has been troubled by its inability to create shareholder value. During the past six years, ROIC at the company has never exceeded 7%. Over this same time period, Williams’ ROIC was less than the cost of deploying the capital in its core business operations, resulting in the company producing negative economic earnings since 2009. NOPAT over the last four years has been equally disappointing. In 2011 Williams’ NOPAT was $1.7 billion. Every year since, NOPAT has declined by a compounded annual rate of 13% to just $1.4 billion in 2014. WMB’s stock price does not reflect the deteriorating and value-destroying nature of its fundamental business operations. Since 2011, WMB’s stock price has increased by 33%. But to justify its current price of $48/share the company would need to grow NOPAT by 16% for the next 14 years . This seems very optimistic given that the company’s historical NOPAT growth over the past decade has been only 3%. Figures 3 and 4 show the rating landscape of all Large Cap Value ETFs and mutual funds. Figure 3: Separating the Best ETFs From the Worst ETFs (click to enlarge) Figure 4: Separating the Best Mutual Funds From the Worst Funds (click to enlarge) Sources Figures 1-4: New Constructs, LLC and company filings D isclosure: David Trainer owns TRV. David Trainer and Allen L. Jackson receive no compensation to write about any specific stock, style, style or theme. Disclosure: I am/we are long TRV. (More…) I wrote this article myself, and it expresses my own opinions. I am not receiving compensation for it. I have no business relationship with any company whose stock is mentioned in this article.

Is Hope For Active Management Right Around The Corner?

By DailyAlts Staff Investors are looking closely at the role of active management relative to passive investing products such as indexed ETFs, and for good reason: Between March 2009 and the end of 2014, less than one-third of active managers beat the broad stock market’s returns. Why should investors pay management fees for active products that fail to generate positive alpha? Perhaps they shouldn’t, but Neuberger Berman’s Juliana Hadas, CFA, and Andrea Pompili argue that the major factors that have contributed to active managers’ underperformance over the past five years are about to change, and that the investment environment is likely to become much more hospitable to active managers in the very near future. Ms. Hadas and Ms. Pompili make their case in the recently published whitepaper, Can Active Management Make A Combeback? “Post-financial crisis underperformance by active portfolio managers is easily explained and, we believe, only temporary,” they write, before outlining three major fundamental factors suppressing active managers’ returns: Unprecedented central bank stimulus leading to ultra-low interest rates; The magnitude of the bull market in U.S. stocks since 2009; and Flows into passive investment vehicles, such as index ETFs. Ultra-Low Interest Rates Ms. Hadas and Ms. Pompili argue that the Federal Reserve’s policy of keeping benchmark interest rates near 0% have created “valuation distortions in the market.” When companies can borrow at low interest rates, they can finance expansion with debt, rather than with cash flow from operations. What’s more, low interest rates narrow the valuation gulf between near term and more distant cash flows, making further out and more speculative cash flows comparatively more attractive than they would be in a higher interest rate environment. The good news for active managers is that the Fed appears to be preparing for an interest rate hike some time in 2015; quite possibly as early as June. Higher interest rates will result in higher financing costs, thereby sharpening the distinction between firms that have been generating profits with easy money financing, and those that have been generating profits through efficient operations. This discrepancy between companies will make it easier for active managers to beat the broad market’s beta returns, whereas the low level of return dispersion in the U.S. stock market over the past five years has made generating alpha difficult. The Stock Bull Market Since ’09 Low interest rates have helped propel the bull market in stocks since 2009, since low financing costs make it easier for U.S. companies to generate profits. According to Ms. Hadas and Ms. Pompili, 70% of the S&P 500’s returns over the past 20 years have been based on earnings, and with earnings generally easier to come by, there has been a low level of dispersion between U.S. large-cap stocks. Another way low interest rates have contributed to the bull market in stocks has been by suppressing bond yields, and thereby encouraging greater risk-taking by income-oriented investors. Stocks are generally viewed as riskier assets than bonds, and investors are taking on greater risk in the face of bond yields well below 3%. But with interest rates expected to rise later this year, that trend is likely to reverse, which should provide opportunity for active investment managers. Passive Indexing Trends With U.S. large-cap stocks generally trending higher over the past five years, it has been more difficult for active managers to beat the market’s “average” (beta) returns. This is a function of the math: If the S&P 500 returns 30% above the risk-free rate of return, and an active manager had a portfolio with a beta of 0.9, then the portfolio would have to generate more than 3% alpha to outperform the market. But if the S&P 500 only exceeded the risk-free rate by 5%, then an active portfolio would only have to generate a little more than 0.5% alpha to beat the market. In somewhat of a vicious cycle, this mathematical reality has led more investors to dump funds into passive index funds, but these funds are inadvertently momentum investments, since they’re market cap-weighted. Investors buying the SPDR S&P 500 ETF (NYSEARCA: SPY ), for example, buy into all 500 components of the S&P 500 in proportion to their index weightings, without regard to the specifics of each company. Large companies that get even larger end up taking up a greater share of the index. Should the markets turn, and active management delivers, then the trend of migrating to indexed ETFs may slow. Conclusion As Ms. Hadas and Ms. Pompili point out, the performance of active managers versus the broad market’s benchmarks tends to be cyclical and to improve during less exuberant bull markets. Once interest rates begin rising, the “valuation distortions” caused by “aggressive central bank easing” will likely reverse, in the view of the whitepaper’s authors, “creating a market environment in which underlying company fundamentals start to once again matter more.”