Tag Archives: original-post

What Small-Cap Blend Funds Can Strengthen Your Portfolio?

Small-cap blend funds are a type of equity mutual funds which holds in its portfolio a mix of value and growth stocks, where the market capitalization of the stocks are generally lower than $2 billion. Blend funds are also known as “hybrid funds”. Blend funds aim for value appreciation by capital gains. It owes its origin to a graphical representation of a fund’s equity style box. In addition to diversification, blend funds are great picks for investors looking for a mix of growth and value investment. Meanwhile, small-cap funds are a good choice for investors seeking diversification across different sectors and companies. Investors with a high risk appetite should invest in these funds. Below we will share with you 5 buy-ranked small-cap blend mutual funds. Each has earned either a Zacks Mutual Fund Rank #1 (Strong Buy) or a Zacks Mutual Fund Rank #2 (Buy) as we expect these mutual funds to outperform their peers in the future. SSgA Enhanced Small Cap N (MUTF: SESPX ) seeks maximum return. SESPX invests a lion’s share of its assets in equity securities of small-cap companies having market capitalizations similar to those included in the Russell 2000 Index. SESPX primarily focuses on acquiring common stocks of companies and may also invest in IPOs, fixed-income securities and money market funds. The SSgA Enhanced Small Cap N fund has returned 8.6% over the past one year. SESPX has an expense ratio of 0.75% compared to a category average of 1.24%. Fidelity Stock Selector Small Cap (MUTF: FDSCX ) invests a large chunk of its assets in common stocks of companies having market capitalizations within the universe of the Russell 2000 Index or the S&P SmallCap 600 Index. FDSCX seeks capital growth by investing its assets across a wide range of sectors. The Fidelity Stock Selector Small Cap fund has returned 10.1% over the past one year. As of April 2015, FDSCX held 197 issues, with 1.35% of its total assets invested in Bank of the Ozarks Inc. Thrivent Small Cap Stock A (MUTF: AASMX ) seeks capital appreciation over the long term. AASMX invests a majority of its assets in securities of companies having market capitalizations similar to those listed in the S&P Small Cap 600 Index or the Russell 2000 Index. AASMX primarily focuses on acquiring common stocks of domestic companies. The Thrivent Small Cap Stock A fund has returned 9.4% over the past one year. Matthew Finn is one of the fund managers and has managed AASMX since 2013. Vanguard Strategic Small-Cap Equity Investor (MUTF: VSTCX ) invests a major portion of its assets equity securities of small-cap firms that are located in the US. VSTCX invests in securities of companies that are expected to have an impressive growth potential and favorable valuation as compared to its industry peers. VSTCX evaluates the holdings of the MSCI US Small Cap 1750 Index in order to maintain a similar risk profile. The Vanguard Strategic Small-Cap Equity Investor fund has returned 10.1% over the past one year. VSTCX has an expense ratio of 0.38% compared to a category average of 1.24%. Fidelity Series Small Cap Opportunities (MUTF: FSOPX ) seeks capital growth over the long run. FSOPX invests a large share of its assets in securities of companies having market capitalizations within the range of the Russell 2000 Index or the S&P SmallCap 600 Index. FSOPX uses a “blend” strategy to invest in companies throughout the globe across a large number of sectors. The Fidelity Series Small Cap Opportunities fund has returned 8.8% over the past one year. As of April 2015, FSOPX held 196 issues, with 1.39% of its total assets invested in Bank of the Ozarks Inc. Original Post
Value Or Momentum? Try Both

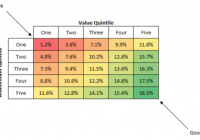
Let’s go back in time 30 years. Remember those “Taste great/less filling” Miller Lite beer commercials from the mid-1980s? You could roughly divide the world’s beer-drinking population into two rival factions: Those that insisted that Miller Lite tasted great… and those that insisted it was less filling. I believe many men lost their lives fighting over this in bars. And I suppose as far as causes go, it’s as good of a cause as any to die for. I consider Miller Lite to neither taste particularly great nor be particularly easy on my stomach. As a native Texan, my heart will always belong to Shiner Bock. But I digress. We’re not here today to discuss beer dogmatism but the far more practical world of investing. As with Miller Lite fans, you can roughly divide the investing world into two camps: Those who favor value strategies and those that favor momentum strategies. Both camps will insist that the academic research – and real world experience – prove that “their way” beats the market over time. And both camps are absolutely right. Simple value screens like Joel Greenblatt ‘s ” Magic Formula ” have beaten the market by a wide margin, and research has shown that a strategy of screening stocks based on simple momentum criteria also beats the market over time. So if value works… and momentum works… what would it look like if we combined the two? Pretty good, actually. Quant guru Patrick O’Shaughnessy wrote an excellent piece last year in which he parses the universe of stocks into value and momentum buckets. Take a look at the following table, taken from O’Shaughnessy’s article. (click to enlarge) The bottom row of the table represents the top 20% of all stocks by momentum. The returns get gradually better as you move down the value scale. In other words, momentum stocks that are cheap outperform momentum stocks that are expensive. And it’s not by a small margin. The cheapest high-momentum stocks returned 18.5% per year, whereas the most expensive high-momentum stocks returned 11.6%. And viewing it through a value lens tells the same story. The right-most column represents the cheapest stocks in the sample using a composite of value metrics. All value-stock buckets performed well. But as you move down the column, the returns get a lot better. In other words, cheap stocks that have recently shown momentum perform better than cheap stocks that don’t. This is a fancier way of repeating the old trader’s maxim to never try and catch a falling knife. Cheap stocks can always get cheaper. What should we take away from this? Value investing works. Momentum investing works. And combining value and momentum works best of all. This article first appeared on Sizemore Insights as Value or Momentum? Try Both. Disclaimer: This site is for informational purposes only and should not be considered specific investment advice or as a solicitation to buy or sell any securities. Sizemore Capital personnel and clients will often have an interest in the securities mentioned. There is risk in any investment in traded securities, and all Sizemore Capital investment strategies have the possibility of loss. Past performance is no guarantee of future results. Original Post

Market Timing With Value And Momentum

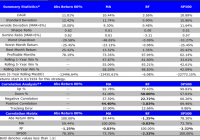
By Jack Vogel, Ph.D. Yesterday, we wrote a post showing a potential way to time the market using valuation-based signals. In the past, we have also examined how to use momentum-based signals (moving average rules and time-series momentum) to time the market. A natural question is, what happens when we combine the valuation-based signals with the momentum-based signals? Here at Alpha Architect, we are big believers in Value and Momentum . We have written about how to combine Value and Momentum in the security selection process here and here . In this post, we examine what happens when we combine valuation-based (value) signals with momentum-based (MA rule) signals. Here is the setup, from yesterday’s post: Strategy Background: We use 1/CAPE as the valuation metric, or the “earnings yield,” as a baseline indicator; however, we adjust the yield value for the realized year-over-year (yoy) inflation rate by subtracting the year-over-year inflation rate from the rate of 1/CAPE. To summarize, the metric looks as follows if the CAPE ratio is 20 and realized inflation (Inf) is 3%: Real Yield Spread Metric = (1/20)-3% = 2% Some details: The Bureau of Labor Statistics (BLS) publishes the CPI on a monthly basis since 1913; however, the data is one-month lagged (possibly longer). For example, the CPI for January won’t be released until February. So when we subtract the year-over-year inflation rate from the rate of 1/CAPE, we do 1-month lag to avoid look-ahead bias. We use the S&P 500 Total Return index as a buy-and-hold benchmark. So the two signals we will use are the following: Valuation-based signal: 80th Percentile Valuation-based asset allocation: Own the S&P 500 when valuation < 80th percentile, otherwise hold risk-free. In other word, if last month's CAPE valuation is in the 80 percentile or higher (data starting 1/1924), buy U.S. Treasury bills (Rf); otherwise stay in the market. Momentum-based signal: Long-term moving average rule on the S&P 500 (Own the S&P 500 if above the 12-month MA, risk-free if below the 12-month MA). The results are gross of any fees. All returns are total returns, and include the reinvestment of distributions (e.g., dividends). Indexes are unmanaged, do not reflect management or trading fees, and one cannot invest directly in an index. Our backtest period is from 1/1/1934 to 12/31/2014. Baseline Results: Here we show the results for 4 portfolios: Valuation-based market timing: Own the S&P 500 when valuation < 80th percentile, otherwise hold risk-free. Momentum-based market timing: Own the S&P 500 if above the 12-month MA, risk-free if below the 12-month MA. Risk-free: Total return to owning U.S. Treasury bills. SP500: Total return to the S&P 500. (click to enlarge) The results are hypothetical, are NOT an indicator of future results, and do NOT represent returns that any investor actually attained. Indexes are unmanaged, do not reflect management or trading fees, and one cannot invest directly in an index. Additional information regarding the construction of these results is available upon request. As previously noted, both Valuation and Momentum-based timing models increase Sharpe and Sortino ratios, while decreasing drawdowns. Now, let's combine them. Combining Value and Momentum Timing models: Here we show the results for 4 portfolios: (50/50) Abs 80%, MA : Each month, allocate 50% of capital to the valuation-based timing model and 50% or capital to the momentum-based allocation model. (and) Abs 80%, MA: Each month, examine the valuation and momentum-based signals. If both say "yes" to being in the market, invest in the S&P 500; if either or both say "no" to being in the market, invest in risk-free. (or) Abs 80%, MA: Each month, examine the valuation and momentum-based signals. If either says "yes" to being in the market, invest in the S&P 500; if both say "no" to being in the market, invest in risk-free. SP500: Total return to the S&P 500. (click to enlarge) The results are hypothetical, are NOT an indicator of future results, and do NOT represent returns that any investor actually attained. Indexes are unmanaged, do not reflect management or trading fees, and one cannot invest directly in an index. Additional information regarding the construction of these results is available upon request. Takeaways: Combining the Value and Momentum-based signals makes sense when using the "50/50 model" and the "(or) model." Both of these have higher Sharpe and Sortino ratios compared to standalone value and momentum-based models. The "(and) model" does not work very well - you are out of the market too often. Conclusion: Of course, transaction costs and taxes (not shown in the results above) need to be considered. However, it appears that combing Value and Momentum in market timing is promising, and something we will examine more carefully in the future. Original Post