Tag Archives: opinion

ACIM Appears To Have Incredibly Low Risk, But That’s Inaccurate

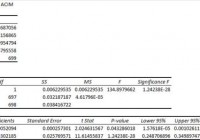
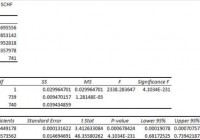
Summary I’m taking a look at ACIM as a candidate for inclusion in my ETF portfolio. The correlation appears to be very low, but the low liquidity caused days with no trades. The same liquidity issues might have improved the standard deviation of returns. The premium to NAV makes it look like a potential short candidate. I’m not assessing any tax impacts. Investors should check their own situation for tax exposure. Investors should be seeking to improve their risk adjusted returns. I’m a big fan of using ETFs to achieve the risk adjusted returns relative to the portfolios that a normal investor can generate for themselves after trading costs. I’m working on building a new portfolio and I’m going to be analyzing several of the ETFs that I am considering for my personal portfolio. One of the funds that I’m considering is the SPDR® MSCI ACWI IMI ETF (NYSEARCA: ACIM ). I’ll be performing a substantial portion of my analysis along the lines of modern portfolio theory, so my goal is to find ways to minimize costs while achieving diversification to reduce my risk level. What does ACIM do? ACIM attempts to track the total return of the MSCI ACWI IMI Index. At least 80% of funds are invested in companies that are part of the index, or in ADRs (American Depositary Receipts). ACIM falls under the category of “World Stock”. Does ACIM provide diversification benefits to a portfolio? Each investor may hold a different portfolio, but I use (NYSEARCA: SPY ) as the basis for my analysis. I believe SPY, or another large cap U.S. fund with similar properties, represents the reasonable first step for many investors designing an ETF portfolio. Therefore, I start my diversification analysis by seeing how it works with SPY. I start with an ANOVA table: (click to enlarge) The correlation is an absurdly low 40%. If an investor stopped here, they would be dramatically misinformed about the risks of ACIM. The correlation is very low as a statistical measure, but the metric is being substantially enhanced by a lack of liquidity in the stock which caused several days to report no change in the price of securities. Standard deviation of daily returns (dividend adjusted, measured since March 2012) The standard deviation is excellent for the international exposure. For ACIM it is .9981%. For SPY, it is 0.7419% for the same period. SPY usually beats other ETFs in this regard, so having a lower standard deviation is excellent. Frequent readers should be aware that I have measured returns from March 2012 instead of my normal starting point of January 2012. I can’t measure values until the ETF is trading and Yahoo is tracking the dividend adjusted close values. Unfortunately, the standard deviation may appear substantially smaller than it should because several days (especially in 2012) reported no change in price. When no sales are reported, the price is not changed and it looks like a low standard deviation of returns. Investors should be aware that there is substantial liquidity risk. The average volume for the last 10 days is only 6,837. Mixing it with SPY I also run comparisons on the standard deviation of daily returns for the portfolio assuming that the portfolio is combined with the S&P 500. For research, I assume daily rebalancing because it dramatically simplifies the math. With a 50/50 weighting in a portfolio holding only SPY and ACIM, the standard deviation of daily returns across the entire portfolio is 0.7320%. If an investor wanted to use ACIM as a supplement to their portfolio, the standard deviation across the portfolio with 95% in SPY and 5% in ACIM would have been .7263%. However, due to the very low correlation, a position of 80% SPY combined with 20% ACIM results in a standard deviation for the portfolio of only .6982%. Investors hoping to capitalize on this low standard deviation of returns would need to have a relatively low need for liquidity since the price stability only works if no large sell orders are being introduced. Why I use standard deviation of daily returns I don’t believe historical returns have predictive power for future returns, but I do believe historical values for standard deviations of returns relative to other ETFs have some predictive power on future risks and correlations. Yield & Taxes The distribution yield is 1.84%. The yield is almost high enough for a retiring investor, in my opinion. Generally, I want to see yields over 2% when considering an ETF for retirement planning. This is close enough that I could still consider it from the perspective of a retiree, but only if the retiree was certain they did not have liquidity needs. I’m not a CPA or CFP, so I’m not assessing any tax impacts. Expense Ratio The ETF is posting .25% for an expense ratio. I want diversification, I want stability, and I don’t want to pay for them. The expense ratio on this fund is higher than I want to pay, but isn’t unbearable for the incredible diversification. Market to NAV The ETF is at a 1.85% premium to NAV currently. Premiums or discounts to NAV can change very quickly so investors should check prior to putting in an order. I wouldn’t want to pay a premium greater than .1% when investing in an ETF. There might be some situations where I would pay .2%, but you won’t see me agreeing to pay that premium. Not happening. If I took a position in this ETF it would be with a carefully monitored limit buy order that adjusted for the premium. If sell orders dropped it to my price, great, if not, I’d rather avoid the ETF entirely than pay that premium. Largest Holdings ACIM has great diversification when you look at the percent in each asset, but the top of the portfolio still has a huge tilt towards the U.S. economy. (click to enlarge) These aren’t bad stocks to hold, but I can get them by holding any of several major ETFs that hold major U.S. companies. The appeal of a world portfolio is having substantial exposure to other markets to help balance out the geographic risks of a U.S. based portfolio. This collection of top holdings supports my belief that the correlation is understated because favorable impacts from days where reported closing price did not change. If ACIM drops to trade at a discount to NAV, I may become very interested in it. Otherwise, regardless of the statistics, I’m not interested in paying a premium for an ETF that holds several of the same companies I can acquire without the premium. Conclusion I’m currently screening a large volume of ETFs for my own portfolio. The portfolio I’m building is through Schwab, so I’m able to trade ACIM with no commissions. I have a strong preference for researching ETFs that are free to trade in my account, so most of my research will be on ETFs that fall under the “ETF OneSource” program. I think the statistics for the ETF are misleading and premium to NAV looks like a poor bet for future returns. When this ETF trades near NAV, it may have some value to investors. I may take a deeper look at it in the future, but for now I think the low liquidity and premium NAV present a real challenge to including it in my portfolio. Due to low liquidity and the potential need to execute a trade over multiple days to create or sell a reasonable position, I would not consider this ETF at all from any account that was required to pay trading commissions on the ETF. If I can short ETFs that are overpriced (without commission), it might become appealing to initiate shorts on the ETF when it is trading over book value if I can own substantially the same securities through other ETFs without paying a premium to acquire them. Additional disclosure: Information in this article represents the opinion of the analyst. All statements are represented as opinions, rather than facts, and should not be construed as advice to buy or sell a security. Ratings of “outperform” and “underperform” reflect the analyst’s estimation of a divergence between the market value for a security and the price that would be appropriate given the potential for risks and returns relative to other securities. The analyst does not know your particular objectives for returns or constraints upon investing. All investors are encouraged to do their own research before making any investment decision. Information is regularly obtained from Yahoo Finance, Google Finance, and SEC Database. If Yahoo, Google, or the SEC database contained faulty or old information it could be incorporated into my analysis. The analyst holds a diversified portfolio including mutual funds or index funds which may include a small long exposure to the stock.

Considering SCHF For Foreign Exposure? Modern Portfolio Theory Can Use It

Summary I’m taking a look at SCHF as a candidate for inclusion in my ETF portfolio. The risk level is relatively high for just holding SCHF, but the correlation to the S&P 500 fixes that. The ETF has a solid dividend yield and diversified holdings. I’m not assessing any tax impacts. Investors should check their own situation for tax exposure. Investors should be seeking to improve their risk adjusted returns. I’m a big fan of using ETFs to achieve the risk adjusted returns relative to the portfolios that a normal investor can generate for themselves after trading costs. I’m working on building a new portfolio and I’m going to be analyzing several of the ETFs that I am considering for my personal portfolio. One of the funds that I’m considering is the Schwab International Equity ETF (NYSEARCA: SCHF ). I’ll be performing a substantial portion of my analysis along the lines of modern portfolio theory, so my goal is to find ways to minimize costs while achieving diversification to reduce my risk level. What does SCHF do? SCHF attempts to track the total return of FTSE developed ex-US Index. The ETF falls under the category of “Foreign Large Blend.” Funds within this category generally invest most of their assets in developed markets. Some will include a small exposure to emerging markets, but different investment managers have different definitions of which markets are “emerging” and which ones are “developed.” Does SCHF provide diversification benefits to a portfolio? Each investor may hold a different portfolio, but I use (NYSEARCA: SPY ) as the basis for my analysis. I believe SPY, or another large cap U.S. fund with similar properties, represents the reasonable first step for many investors designing an ETF portfolio. Therefore, I start my diversification analysis by seeing how it works with SPY. I start with an ANOVA table: (click to enlarge) The correlation is about 76%, which is low enough that I’m expecting to see significant diversification benefits. Standard deviation of daily returns (dividend adjusted, measured since January 2012) The standard deviation isn’t going to make a strong case for investing in SCHF. For the period I’ve chosen, the standard deviation of daily returns was 0.8955%. For SPY, it was 0.7300% over the same period. Clearly, SPY appears to be the safer of the two investments. Mixing it with SPY I also run comparisons on the standard deviation of daily returns for the portfolio assuming that the portfolio is combined with the S&P 500. For research, I assume daily rebalancing because it dramatically simplifies the math. With a 50/50 weighting in a portfolio holding only SPY and SCHF, the standard deviation of daily returns across the entire portfolio is 0.7865%. The risk level on the portfolio drops relative to only holding SPY because of the diversification benefits that come from the 76% correlation. If the position in SPY is raised to 80% while SCHF is used at 20%, the standard deviation of daily returns drops down to 0.7453%. In practice, I think the best way to use SCHF will be a position smaller than 20% and used in a more diversified portfolio. The low correlation makes a very strong case for using SCHF in a small position to enhance diversification. Currently, I’m thinking my exposure to developed markets should be around 5%. At 5%, the standard deviation of the portfolio would be 0.7329%. This is hardly higher than simply holding SPY and indicates that most of the additional risk from the higher standard deviation has been effectively diversified away. Why I use standard deviation of daily returns I don’t believe historical returns have predictive power for future returns, but I do believe historical values for standard deviations of returns relative to other ETFs have some predictive power on future risks and correlations. Yield and Taxes The distribution yield is 2.26%. The SEC 30-day yield is 2.49%. Those yields aren’t bad and make this ETF look attractive as part of a dividend portfolio. However, the ETF invests in foreign securities and I’m not a CPA or CFP. Investors concerned about tax consequences should seek advice from someone knowledgeable about their tax situation. Expense Ratio The ETF is posting .08% for an expense ratio, which is very low. Market to NAV The ETF is trading at a .45% premium to NAV currently. In my opinion, a .45% premium to NAV is a problem for new investors. I think the ETF is significantly less attractive when it trades above NAV. A .10% premium isn’t too bad in my opinion, but .45% bothers me. It’s not terrible, but I’d be cautious about that. Largest Holdings The diversification within the ETF is excellent, as shown by the following chart: (click to enlarge) I don’t love having my portfolio invested in U.S. Dollars (my checking account gives me that exposure), but I can understand the ETF needing to have some cash. With no company over 1.5%, that diversification is great. I have not performed individual research on the holdings, but with no exposure over 1.5%, I don’t think there is a viable case for returns on time in researching the individual holdings. Investing in the ETF is largely relying on modern portfolio theory. The argument for the investment is the respectably low correlation of the portfolio to the major U.S. index funds. Making an investment requires a belief that markets are at least somewhat efficient so that the companies within the portfolio will be reasonably priced. Conclusion I’m currently screening a large volume of ETFs for my own portfolio. I’ll do a little more digging on SCHF later and post what I find. The portfolio I’m building is through Schwab, so I’m able to trade SCHF with no commissions. I have a strong preference for researching ETFs that are free to trade in my account. I think SCHF will merit a fairly small position within that ETF portfolio. The low correlation and the low expense ratio are the driving factors for me. Additional disclosure: Information in this article represents the opinion of the analyst. All statements are represented as opinions, rather than facts, and should not be construed as advice to buy or sell a security. Ratings of “outperform” and “underperform” reflect the analyst’s estimation of a divergence between the market value for a security and the price that would be appropriate given the potential for risks and returns relative to other securities. The analyst does not know your particular objectives for returns or constraints upon investing. All investors are encouraged to do their own research before making any investment decision. Information is regularly obtained from Yahoo Finance, Google Finance, and SEC Database. If Yahoo, Google, or the SEC database contained faulty or old information it could be incorporated into my analysis. The analyst holds a diversified portfolio including mutual funds or index funds which may include a small long exposure to the stock.

CenterPoint Energy: The Sweet Spot For Dividend Growth Investors

With a 4.1% current yield and dividend growth potential of 8% to 10% annually until at least 2018, CenterPoint should be a darling of the DGI crowd. The extra kicker above the usual regulated utility is its interest in ENBL whereby Centerpoint is part owner of the GP and is entitled to a growing IDR. CenterPoint is a model for the Gabelli-driven transformation of National Fuel Gas. Centerpoint Energy (NYSE: CNP ) is a diversified mid-cap utility headquartered in Houston TX. CNP offers electrical distribution in Houston, natural gas distribution, and majority ownership of its former midstream gas assets now spun-off in a publicly traded MLP. According to its November presentation, management forecasts dividend growth of 8% to 10% annually for the next three years, after a 14% increase in 2014. The forecast is based on a utility growth rate of 4-7% and a 10-12% distribution growth rate from its interest in the MLP. With a current yield of 4.1%, CNP should be in the sweet spot for dividend growth investors. The company serves 5.5 million metered customers primarily in Arkansas, Louisiana, Minnesota, Mississippi, Oklahoma, and Texas. The balance between its electric and gas regulated assets provides stability in earnings and cash flow. Below is a recap of operating income for the regulated utilities, from their latest investor’s presentation (pdf): Fourth quarter 2013 core earnings were $87 million for the electric utility and $92 million for the gas segment. Management forecasts full year 2014 earnings per share in the range of $1.14 to $1.21, including a $0.42 to $0.45 contribution from its midstream interests. In addition to its regulated utility activity, CNP owns 55.5% of Enable Midstream Partners LP (NYSE: ENBL ) and has a 40% interest in the general partner of the partnership. ENBL was formed in a joint venture with EOG Energy (NYSE: EOG ) and private equity firm ArcLight Capital Partners, and went public in April of 2014. While the regulated assets will grow in proportion to the capital investments for upgrades and expansion made over the next few years, ENBL will be a driver of added free cash flow. By the end of 2015, CNP should begin earning higher incentive distribution rights IDR. One strong advantage of most general partnerships is the profitability of IDRs. Usually, the GP earns a growing percentage of cash flow available for distribution to limited partners as an incentive to continue profitably growing the underlying business. CNP is no exception. According to the IPO prospectus , the general partners are eligible to earn as follows: The first $0.331 in quarterly distributions, 100% to the unit holders; From $0.331 to $0.394 in quarterly distributions, 85% to unit holders and 15% to GP (threshold $0.36 to unit holders, $0.034 to GP); From $0.394 to $0.523 in quarterly distributions, 75% to unit holders and 25% to GP (threshold $0.43 to unit holders, $0.093 to GP); Over $0.523 in quarterly distributions, 50% to unit holders, 50% to GP. Stated another way, on an annual basis, unit holders receive the first $1.324 in distributions, then a total of $1.44 of $1.60, then $1.72 of $2.09, then half of any cash over $2.09 per unit available for distribution. With ownership of around 245 million ENBL shares (out of 442 million outstanding) and a 40% interest in the GP and associated IDRs, CNP will reap a steady distribution and IDR cash stream. Morningstar offers a very upbeat assessment of CenterPoint in an article published this month titled, “Utilities’ Dividends: Best of Breed”: We think investors should be able to count on management’s 8%-10% annual dividend growth guidance even though the company’s utility operating earnings are growing at only half this rate. Our confidence is based on the distributions from Enable Midstream Partners, expected to provide the largest component of the cash available for dividends. During its third-quarter earnings call, Enable reiterated its 10%-12% distribution growth guidance for 2014 and 2015 and reaching low general partner splits by the fourth quarter of 2015. Management has reiterated that future dividends will be based on 60%-70% sustainable utility earnings and 90%-100% of after-tax distributions from Enable. Management continues to target 4%-6% annual earnings growth for its utility operations during the next five years, in line with our expectations. However, management did indicate it would probably be back-end-loaded due to the acceleration of capital expenditures and the lag in rates reflecting these investments. Also a drag on earnings growth is the expected reduction in right-of-way revenue to normal levels. Houston Electric’s rate base is expected to grow 7%-8% annually during the next five years, although potential investments like the $300 million Houston Import Project could push rate base growth to 9%-10%. The natural gas utilities’ rate base is projected to increase at 8%-9% annually, but upside could push it to 10%. Morningstar also offers this opinion in another research piece: Bulls Say: The 14.5% common dividend increase in 2014 is a positive signal of the earnings power of CenterPoint’s regulated utilities and anticipated cash distributions from Enable. We expect average annual dividend increases near 9% during the next five years. The formation of Enable will allow CenterPoint to focus capital expenditures on its utilities, resulting in almost 8% rate base growth during the next five years. Houston Electric’s service territory is located in one of the most economically vibrant metro areas in the country with annual customer growth averaging 2%. Bears Say: The Transmission and Distribution segment’s operating earnings have recently benefited from abnormally high transmission right-of-way revenues. These revenues will likely decline in 2014 and beyond. Profitability in the competitive natural gas sales and service business remains challenging, with low basis differentials and severe competition. Low commodity prices and reduced gathering activity continue to pressure earnings from the pipelines and field services infrastructure serving dry gas regions. This will be a headwind for Enable. CNP has generated return on invested capital ROIC slightly ahead of industry average of approximately 5%. Below is a 15-yr graph of ROIC, courtesy of fastgraph.com: (click to enlarge) According to ThatsWACC.com, CNP’s cost of capital is 4.9% versus a 3-yr average ROIC of 5.7% and a 10-yr average ROIC of 5.2%. Unlike many utility peers, CNP management has historically generated returns on its total capital base in excess of its cost of capital. Concerning its regulatory environment, CNP operates in a relatively neutral setting. The important states for regulatory environments are Texas, Arkansas and Minnesota. Less than 9% of gas utility income is generated in Mississippi, Louisiana and Oklahoma. While the categories have changed a bit in 2014, below is a table of the US Utility Regulatory Environment Assessment, according to S&P Credit analysis. There was a shift in category structure in 2014, reducing the effective number from four to three, with Credit Supportive considered neutral prior to 2014 and Strong/Adequate considered neutral post 2014 realignment. Below is a table of the regulatory assessment pre-2014 and post-2014. Source: S&P Credit Dividend growth and utility investors should review CenterPoint Energy as a top quality, core holding. Author’s Note: National Fuel Gas (NYSE: NFG ) has a similar business model to CNP prior to the spinning-off of midstream assets into ENBL. Money-manager Mario Gabelli, who owns about 10% of outstanding NFG shares, is pushing management to split the company, much like Oneok (NYSE: OKE ) and CNP. In the era of maximizing shareholder returns through spinning off assets, NFG may the next in line. More information on NFG can be found in two previous SA articles last Sept and May . Please review important disclaimer in author’s profile.