Tag Archives: opinion

Why Should You Buy EQT Corporation?

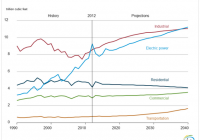
Summary EQT’s strong and well-diversified asset base will successfully support its ability to cater to the growing market. Moreover, the company plans to drill about 181 wells this year, which will further expand its production capacity. EQT’s leading cost structure and financial flexibility further aid its future growth. Based in Pittsburgh, Penn., EQT Corporation (NYSE: EQT ) is one of the largest natural gas producers in the Appalachian Basin and has been reporting healthy financial results for over a decade. Its improving financial performance year over year is indicative of the company’s strong business model. In my opinion, the company enjoys a strong competitive position in the market because of factors that not only support its future profitability, but also make it a worthy investment in the long term. Let’s analyze a few of these factors. Strong Asset Base Supports Its Ability to Successfully Cater to the Growing Market According to the U.S. Energy Information Administration (EIA), the demand for natural gas is expected to sharply rise in the coming years. Consumption is expected to increase from 25.6 trillion cubic feet (Tcf) in 2012 to about 31.6 Tcf in 2040, reflecting a compounded annual growth rate of nearly 0.7%. Except for residential, the use of natural gas is expected to rise in every end-use sector. The demand for gas in the residential sector has declined as a result of many U.S. citizens moving to warmer areas of the country. Source: EIA . I believe EQT can successfully accommodate the growing demand for natural gas as it owns a diversified and strong asset base. The company has been a major player in the Appalachian Basin for more than 120 years and seems to be taking full benefit of the Marcellus play, which is one of the most productive natural gas plays in North America. EQT owns about 3.6 million gross acres, which includes nearly 580,000 gross acres in the Marcellus play. It has total reserves of about 36.4 trillion cubic feet equivalent (Tcfe) of which half (18.5 Tcfe) are located in the Marcellus play, which has registered an annual growth rate of about 32% during the past few years. The company has over 14,500 gross productive wells, and has been witnessing a strong growth in its natural gas and oil reserves over the past few years. The total proved reserves grew from only 4,068 billion cubic feet equivalent (Bcfe) in 2009 to about 8,348 Bcfe in 2013. That reflects an annual increase of about 15%. Source: Investor Presentation . Moreover, the company plans to drill about 181 wells this year, which will further expand its production capacity — thus strengthening its ability to successfully cater to the growing market. Industry Leading Cost Structure and Financial Flexibility Accelerate Future Earnings EQT has an attractive cost structure that would definitely help it generate attractive profits, compared to those in its peer group. The company incurs nearly $0.88 per Mcfe of finding and development costs compared to the industry average of $2.74 Mcfe. The operating expenses per unit of $0.52 incurred by EQT is also much lower than the industry average of $1.68. Source: Investor Presentation . Furthermore, the company has ample liquidity to successfully execute its business plan. The total cash and cash equivalents and restricted cash increased from $845 million at the beginning of 2014 to nearly $1,355 million at the end of the third quarter of 2014, reflecting an attractive rise of about 60%. The company’s current net debt to total capital ratio is 21% and looks quite reasonable. Moreover, except for $166 million of debt maturing this year, no major debts/liabilities are payable earlier than 2018. The manageable debt maturities have raised EQT’s ability to appropriately finance future drilling operations and important projects, thus increasing its profitability. Source: Investor Presentation . A Risk to Consider Natural gas is a commodity and therefore the company receives market-based pricing. The market for natural gas is quite volatile and any fluctuation in its price can significantly affect EQT’s future revenues and profits. The current market scenario does not seem to favor EQT as natural gas prices continue to fall. During December 2014, the U.S. natural gas price declined below $3 per million British thermal units for the first time since 2012. The rapidly rising production of natural gas along with comparatively stable demand will put downward pressure on its price. According to some estimates, increasing natural gas production will leave inventories at a level of more than 4 trillion cubic feet by the end of October 2015. Analysts have lowered their estimates for average natural gas price in 2015 from $3.75 per million Btu to $3.60. Although EQT exercised a few hedging activities to protect its cash flows from exposure to the risk of changing commodity prices, it still cannot fully immunize itself from the any fluctuation in natural gas market. The company utilizes several derivatives commodity instruments, including NYMEX swaps, collars and futures where it enters into fixed price natural gas sales agreements. However, these agreements involve contracts that fix only the NYMEX portion of the price and contracts that fix the NYMEX and basis. In this way, the full price still cannot be hedged, thus putting the company’s future profitability at risk. Conclusion The sum and substance of my analysis is that EQT is well-positioned to cater to the growing natural gas market. EQT’s diversified and strong asset base and industry-leading cost structure give it an edge over its industry peers. Moreover, EQT’s financial flexibility further supports the successful execution of its business plan. Based on my analysis, I give the stock a buy rating. Disclosure: The author has no positions in any stocks mentioned, and no plans to initiate any positions within the next 72 hours. (More…) The author wrote this article themselves, and it expresses their own opinions. The author is not receiving compensation for it (other than from Seeking Alpha). The author has no business relationship with any company whose stock is mentioned in this article.

Investing In The Russian Market: Oil ETFs Are Better Than Russia-Focused ETFs

The Russian Central Bank surprisingly cuts the key rate to 15%. The implementation of the anti-crisis plan meets first obstacles. ETFs that focus on Russia are unlikely to rise at the same pace as oil ETFs in case of an oil price upside. Russian market has recently been under serious pressure due to sanctions, falling oil prices, devaluation of the ruble and weakening economy. A number of investors believe that the Russian market is cheap right now and await an oil price upside, hoping that it will provide significant upside to ETFs that focus on Russia, like the Market Vectors Russia ETF (NYSEARCA: RSX ), iShares MSCI Russia Capped ETF (NYSEARCA: ERUS ) and SPDR S&P Russia ETF (NYSEARCA: RBL ). However, I would like to argue that investors will be better off investing in oil ETFs, like The United States Oil ETF (NYSEARCA: USO ) or The United States Brent Oil ETF (NYSEARCA: BNO ), if they believe in a bright future for oil prices. Currently, energy accounts for 43.04% of RSX holdings , 49.63% of RBL holdings and 51.97% of ERUS holdings . This means that approximately one half of holdings of these ETFs is not directly related to oil prices. One could argue that oil prices are the single-most important factor for the Russian economy. When oil prices rise, the economy and all its sectors feel better. While this is partly true, I think that there are negative factors that will pressure RSX, ERUS and RBL. The first factor is the continuing devaluation of the ruble. In my view, rising oil prices will not provide a corresponding upside for the currency. This point was recently highlighted by the surprise cut of the key interest rate by the Russian Central Bank on January 30. While Brent oil prices have enjoyed a significant upside since then, the ruble remained roughly unchanged. When the Central Bank was raising its key rate to 17% in December, it stated that these measures were necessary because of ruble depreciation risks and inflation risks. While commenting on the reduction of the key rate from 17% to 15%, the Central Bank stated that it saw a stabilization of inflation and depreciation expectations. In my view, this is a rather strange conclusion. The Central Bank stated that annual consumer price growth rate was 13.1% as of January 26. In comparison, 2014 inflation totaled 11.4%. These numbers show that inflation is increasing rather than stabilizing. The Russian ruble started this year at 59.18 to the dollar. It is trading at 68.92 to the dollar as I’m writing this article. In my view, a 16% devaluation of the ruble cannot be called a “stabilization of depreciation expectations”. Meanwhile, a 15% key rate is still prohibitive for most businesses, and the recent interest rate cut might signal a shift in the Central Bank’s policy. Further rate cuts will lead to more downside for the ruble, pushing RSX, ERUS and RBL lower. The second thing that I’d like to mention is the government’s anti-crisis plan . While the government is sure that it has enough reserves to ensure the implementation of this plan, the process is not going smoothly. The Russian Ministry of Finance stated (please note that the link is in Russian) ( Google translate link ) that it would not be able to allocate enough funds for several anti-crisis measures. While the Ministry of Economic Development proposed to spend 40 billion rubles ($580 million) on credits for Russian regions in the first quarter of 2015, the Ministry of Economic Development is ready to allocate just 10 billion rubles ($145 million) for these measures. In my view, it will take time before the Russian government is able to develop a unified position on the implementation of the anti-crisis plan. Meanwhile, the economy is suffering, and Morgan Stanley is predicting that Russia’s GDP will drop by 5.6% in 2015. In my view, the lack of coordination within the government supports my previous thesis that the situation in the Russian economy will get worse before it gets better. I believe that the fate of the Russian economy remains in the hands of oil prices. I remain skeptical on the current anti-crisis measures. What’s more, I think that ETFs that focus on Russia won’t be able to outperform oil ETFs in the near term. I think that further depreciation of the ruble and problems with the implementation of the anti-crisis plan will hit the non-energy part of RSX, ERUS and RBL portfolios. In my opinion, if an investor is bullish on oil, they should buy oil ETFs rather than ETFs that focus on Russia. Disclosure: The author has no positions in any stocks mentioned, and no plans to initiate any positions within the next 72 hours. (More…) The author wrote this article themselves, and it expresses their own opinions. The author is not receiving compensation for it (other than from Seeking Alpha). The author has no business relationship with any company whose stock is mentioned in this article.

Vanguard’s All-World Ex-US Fund Sounds So Good, But Hasn’t Performed

Summary When I’m contemplating funds for my IRA, I like to use Modern Portfolio Theory. The risk level and correlation measured on a daily a basis are unattractive, though the correlation appears much lower in longer scenarios. Despite a great expense ratio and strong dividend yield, I have a hard time getting excited about VEU. It’s a solid ETF, but I’m less excited for it than I usually am for Vanguard funds. Investors should be seeking to improve their risk-adjusted returns. I’m a big fan of using ETFs to achieve the risk-adjusted returns relative to the portfolios that a normal investor can generate for themselves after trading costs. I’m working on building a new portfolio, and I’m going to be analyzing several of the ETFs that I am considering for my personal portfolio. One of the funds that I’m considering is the Vanguard FTSE All-World ex-US Index ETF (NYSEARCA: VEU ). I’ll be performing a substantial portion of my analysis along the lines of Modern Portfolio Theory, so my goal is to find ways to minimize costs, while achieving diversification to reduce my risk level. What does VEU do? VEU uses an indexing approach to track the performance of the FTSE All-World ex-US Index. The first thing I’m looking for is diversification. If the ETF really brings great diversification and can effectively represent all virtually all of the non-US market, then it should be an incredible fit for my portfolio. However, I want to run my own statistics to get a better feel for the performance of the ETF. Does VEU provide diversification benefits to a portfolio? Each investor may hold a different portfolio, but I use the SPDR S&P 500 Trust ETF (NYSEARCA: SPY ) as the basis for my analysis. I believe SPY, or another large cap U.S. fund with similar properties, represents the reasonable first step for many investors designing an ETF portfolio. Therefore, I start my diversification analysis by seeing how it works with SPY. I start with an ANOVA table: (click to enlarge) The correlation measured on a daily basis is higher than I would expect. Given that the ETF is expected to represent all of the non-U.S. market, I was hoping for a correlation closer to 70%. There are plenty of REIT ETFs that have lower levels of correlation. I feel like this ETF may be seeing more of a correlation to the U.S. market than it really should. I want to see low correlations, and this doesn’t seem to offer that. Since it feels wrong for there to be such a strong correlation, I decided to test the statistics against eyeballing the chart. Remember that I’m looking at statistics on a daily basis, so the influences can be money flowing in and out of the market. The image below is a 5-year price chart from Google Finance. (click to enlarge) VEU has performed quite poorly if measured over the entire period. However, it appears clear from the graph that while the correlation of daily returns is high, the overall direction of the lines is not impacted as strongly. Therefore, over a long time period, I would expect the diversification benefits to be better than they are over the short term. In the short term, the ETF moves up and down with SPY, but over the longer term, the performance is dictated by other factors. Standard deviation of daily returns (dividend adjusted, measured since January 2012) The standard deviation is higher than I would expect for an ETF that is expected to be so broad. For VEU, it is .905%. For SPY, it is 0.736% for the same period. The higher volatility, combined with high daily correlation and very unimpressive results over the last 5 years aren’t very attractive to me. I looked back at the numbers since inception, and they aren’t very attractive either. A portfolio split half and half between VEU and SPY, which I’m not recommending, would have scored a .793% for the daily standard deviation. Due to the high correlation and high standard deviation, the daily statistics don’t support the ETF offering much in the way of diversification benefits. Clearly, the long-term price chart shows that there is some substantial diversification. However, I’d be concerned if I allocated a large portion of the portfolio to it. Why I use standard deviation of daily returns I don’t believe historical returns have predictive power for future returns, but I do believe historical values for standard deviations of returns relative to other ETFs have some predictive power on future risks and correlations. Liquidity is great The average trading volume is over 2.4 million shares per day. I have absolutely no liquidity concerns. Yield The distribution yield is 3.52%. That is a fairly attractive yield. This ETF could be worth considering for retiring investors. I like to see strong yields for retiring portfolios, because I don’t want to touch the principal. Higher yields imply lower growth rates (without reinvestment) over the long term, but that is an acceptable trade-off, in my opinion. If the long-term diversification benefits and strong distribution yield encouraged retirees to keep their hands out of the portfolio, that would make the ETF substantially more attractive for investors that needed help in that regard. Expense Ratio The ETF is posting .15% for both gross and net expense ratios. For the expected diversity in the equity securities being held and the risk factors affecting the ETF, that is a very attractive expense ratio. In my opinion, .15% is a fairly attractive expense ratio, regardless of what the ETF is doing. Generally, I think anything less than .20% is doing well for expense ratios. Market-to-NAV The ETF is at a .06% premium to NAV currently. That isn’t large enough to matter for a long-term holder. Check before trading, but I wouldn’t expect to see this ETF deviate from the NAV by a meaningful amount. Largest Holdings The diversification within the holdings looks great. (click to enlarge) Conclusion I’m currently screening a large volume of ETFs for my own portfolio. I have a total of five portfolios that I am personally connected to. My wife and I both have Traditional and Roth IRAs. I also have a solo 401K. The 401K is through Schwab, so I have a preference for ETFs on the OneSource list for that account. The four IRA accounts are with a different brokerage that does offer me any incentives to pick certain ETFs. In those accounts, I will have a preference for using a smaller number of ETFs to achieve my diversification, due to trading costs. Vanguard funds are very attractive, in my opinion, for any accounts that don’t already have commission-free trading. In general, they have low expense ratios and solid diversification. I was given the impression that this ETF would be a strong contender for one or two of the IRA accounts, but so far, I’m not convinced. My current IRA uses some mutual funds that were relatively low-fee, with no trading costs. I want to make some fairly substantial changes. Over the course of a few months, the trading commission on buying into some low-fee ETFs should be covered by the lower expense ratios. The trading costs will encourage me to rebalance less frequently. That makes low volatility even more important to me. I’m stuck in a hard situation with assessing VEU. I love the idea of getting exposure to all the foreign markets with a single ETF, because it reduces trading costs. I don’t like the daily correlation values, but the long-term chart shows that the performance of the VEU isn’t as strongly tied to the S&P 500 as it would appear. For my IRAs (non-Schwab, so no OneSource), the strongest contenders so far for major positions are the Vanguard Total Stock Market ETF (NYSEARCA: VTI ) and Vanguard REIT Index ETF (NYSEARCA: VNQ ). If I can’t find an option that really appeals to me as a single ETF to cover foreign exposure in the IRAs, I may accept going without the foreign exposure. Additional disclosure: Information in this article represents the opinion of the analyst. All statements are represented as opinions, rather than facts, and should not be construed as advice to buy or sell a security. Ratings of “outperform” and “underperform” reflect the analyst’s estimation of a divergence between the market value for a security and the price that would be appropriate given the potential for risks and returns relative to other securities. The analyst does not know your particular objectives for returns or constraints upon investing. All investors are encouraged to do their own research before making any investment decision. Information is regularly obtained from Yahoo Finance, Google Finance, and SEC Database. If Yahoo, Google, or the SEC database contained faulty or old information, it could be incorporated into my analysis. The analyst holds a diversified portfolio, including mutual funds or index funds, which may include a small long exposure to the stock.