Tag Archives: opinion

Short-Term VIX Futures Products Should Be Avoided Until Better Opportunities Arise

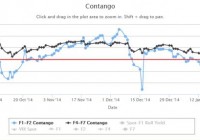
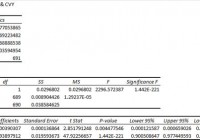
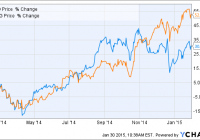
All four major VIX short-term futures ETPs are negative over the past six months. Backwardation has occurred much more frequently in the past three months. The VIX is signaling a lack of direction in the market. In this article, my main theme will be what the VIX futures are saying about the market and why you should be patient. We will take a look at some popular VIX ETFs such as the ProShares Ultra VIX Short-Term Futures ETF (NYSEARCA: UVXY ), the ProShares Short VIX Short-Term Futures ETF (NYSEARCA: SVXY ), the VelocityShares Daily Inverse VIX Short-Term ETN (NASDAQ: XIV ), and the iPath S&P 500 VIX Short-Term Futures ETN (NYSEARCA: VXX ). As you can see below, VIX futures have been in backwardation quite frequently, especially when compared to 2012, 2013, and the beginning of 2014. Last month, I published an article that recommended a shift in focus from the pure contango and backwardation strategy to the percentage of backwardation strategy. You can view that article here . I continue to recommend this strategy given the current market conditions. (click to enlarge) Over the past three years, we have enjoyed a relatively subdued VIX. Historically, this is not abnormal in a bull market. However, as seen in the chart below, these periods (within the last 25 years) have only lasted, at most, about five years. (click to enlarge) Chart obtained from Yahoo! Finance by Nathan Buehler If you have followed my past publications, you know I take an optimistic view towards the U.S. economy. I continue to be concerned about the level of debt and liabilities within the U.S. government. It seems, as a global economy, debt has become an acceptable part of the budget. Living beyond your means for a long period of time will eventually have consequences. When those consequences will affect the economy is when politicians begin to address the problem. I don’t see that happening anytime in the near future. The Federal Reserve has undoubtedly, in my opinion, been the number one driver of the VIX for the past five years. Through massive amounts of monetary stimulus and an ever reassuring tone, it has encouraged the market to record highs. My takeaway from current events is that the Federal Reserve will continue to support the market and the U.S. economy at any cost. I expect to see low rates for the foreseeable future unless inflation begins to run over the proposed targets. The current VIX is signaling a lack of direction in the market. There is uncertainty surrounding U.S. monetary policy going forward. When will rates rise and by how much are common questions being discussed. Global growth has been revised downward several times. Investors are unsure if the U.S. can continue to sustain growth in these challenging conditions. This is exactly what the VIX is intended to measure, uncertainty and fear. It is currently right on target. Both UVXY and VXX have outperformed their inverse counterparts over the past three months. This is especially positive for VXX considering it does not have the leverage that UVXY provides. This is something we have not seen, for a prolonged period of time, since 2011. All four instruments are negative over the past six months. As of 2/6/2015, VXX was down less than 1% over the same time period. (click to enlarge) Chart made by Nathan Buehler using historical VIX data obtained from the CBOE As you can see from the data above, over the past 11 years, we have only seen backwardation drop below -10% (significantly) five times. Given the current global economic outlook, I would not be surprised to see the VIX futures testing a -10% backwardation level sometime in 2015. When uncertainty in the VIX presents itself, the best tool to have in your investing portfolio is patience. Sometimes you will have missed opportunities, or feel that way, until you are rewarded for waiting patiently. You only need one correct trade a year in the VIX to outperform the major benchmarks. I have been extremely cautious over the last several months and it has paid off. Nothing has presented enough potential reward to balance the current risk. These back and forth swings in the market only decay the value of short-term ETPs (pro and inverse). My strategy has always been to short the VIX once “extreme” levels are breached. Different periods of economic activity dictate different levels of “extreme”. This strategy can be executed through purchasing inverse products, shorting pro-VIX products, options, or a combination. Please see my library and Instablog for more information on specific strategies. My current recommendation is to avoid all the short-term VIX-related products until a better opportunity presents itself. None of these products are buy-and-hold investments. If you have any questions or are new to trading the VIX, please view my library of articles to gain a better understanding of your risks. As 2015 progresses, I will continue to publish updates on the VIX futures and its related ETPs. I highly appreciate you reading and hope you find this information helpful in your investing decisions. Disclosure: The author has no positions in any stocks mentioned, and no plans to initiate any positions within the next 72 hours. (More…) The author wrote this article themselves, and it expresses their own opinions. The author is not receiving compensation for it (other than from Seeking Alpha). The author has no business relationship with any company whose stock is mentioned in this article.

CVY Brings Equities And Bonds To Create A Balanced Portfolio

Summary I’m taking a look at CVY as a candidate for inclusion in my ETF portfolio. I like the idea behind the ETF, but I’m not sold on using it over the portfolios I can create myself. The yields on the ETF are extremely high which may make it more appealing for retiring investors seeking income without touching their portfolios. The overall risk level isn’t bad at all, though the returns have been fairly moderate through my testing period. Investors should be seeking to improve their risk adjusted returns. I’m a big fan of using ETFs to achieve the risk adjusted returns relative to the portfolios that a normal investor can generate for themselves after trading costs. I’m working on building a new portfolio and I’m going to be analyzing several of the ETFs that I am considering for my personal portfolio. A substantial portion of my analysis will use modern portfolio theory, so my goal is to find ways to minimize costs while achieving diversification to reduce my risk level. In this article I’m reviewing the Guggenheim Multi-Asset Income ETF (NYSEARCA: CVY ). What does CVY do? CVY attempts to track the investment results of an index Zack’s Multi-Asset Income Index. The ETF falls under the category of “Large Value.” Does CVY provide diversification benefits to a portfolio? Each investor may hold a different portfolio, but I use the SPDR S&P 500 Trust ETF (NYSEARCA: SPY ) as the basis for my analysis. I believe SPY, or another large cap U.S. fund with similar properties, represents the reasonable first step for many investors designing an ETF portfolio. Therefore, I start my diversification analysis by seeing how it works with SPY. I start with an ANOVA table: (click to enlarge) The correlation is about 88%, which is low enough that I’m expecting to see some diversification benefits, but higher than I would like to see for having a unique tracking index. Standard deviation of daily returns (dividend adjusted, measured since January 2012) The standard deviation is going to make a stronger case for investing in CVY. For the period I’ve chosen, the standard deviation of daily returns was .698 %. For SPY, it was 0.748% over the same period. This may be a benefit of the mixed assets that the ETF is holding. Mixing it with SPY I also run comparison on the standard deviation of daily returns for the portfolio assuming that the portfolio is combined with the S&P 500. For research, I assume daily rebalancing because it dramatically simplifies the math. With a 50/50 weighting in a portfolio holding only SPY and CVY, the standard deviation of daily returns across the entire portfolio is 0.701%. The risk level on the portfolio drops relative to only holding SPY because of both the lower deviation from CVY and the correlation. Based solely on this information, it would appear an investor thinking about going all in on CVY could put about half in SPY and retain a similar risk level as long as the risk is measured in the daily volatility. If the position in SPY is raised to 80% while CVY is used at 20% the standard deviation of daily returns increases to .724%. At 5%, the standard deviation of the portfolio would have been 0.741%. If an investor was basing their decision solely on risk level, there could be significant incentives to using a large position in a relatively stable ETF like CVY. However, CVY has substantially underperformed SPY in the period, and I would expect that to be a long term trend because of the less aggressive portfolio that CVY is holding. Why I use standard deviation of daily returns I don’t believe historical returns have predictive power for future returns, but I do believe historical values for standard deviations of returns relative to other ETFs have some predictive power on future risks and correlations. While poor liquidity could impact the reliability of statistics, the ETF had 0 days with no trading volume, so price movements should be recorded as they happened. The average volume is currently around 330,000 shares per day. Yield & Taxes The distribution yield is 6.40%. It is a fairly massive yield, which may be an attractive factor for retirees hoping to live off the distributions. The high distributions will limit the growth rate of the investment in the fund, but for retirees that are concerned about overreacting to movements in the market, a high distribution ETF with lower volatility makes sense. Expense Ratio The ETF is posting .84% for a net expense ratio and .89% for the gross ratio, which is higher than I’d like to see. Unfortunately, most ETFs have expense ratios higher than I’d like to see. There may be some legitimate reasons for a high expense ratio, but I find ETFs with lower expense ratios to be substantially more attractive. One of the reasons I’m overhauling my portfolio is to get away from funds that have higher expense ratios. Market to NAV The ETF is trading at a .18% discount to NAV currently. I think any ETF is significantly less attractive when it trades above NAV. The discount looks very nice, but the discount is also less than one fourth of the annual expense ratio. In that context, the discount becomes less attractive as a feature of total return for a long term investor. Largest Holdings The diversification within the holdings is substantial. Due to the combination of equities and other funds included in the profile, I’ve prepared two charts for the holdings. The first shows the equity holdings and the second shows the other funds. (click to enlarge) (click to enlarge) Investing in the ETF is largely relying on modern portfolio theory. Making an investment requires a belief that markets are at least somewhat efficient so that the companies within the portfolio will be reasonably priced. Conclusion I love the idea of a diversified ETF that can deliver everything investors are seeking within a single ETF. However, I’d rather go with SPY (or an equivalent) and just eliminate the bond position entirely if I had to pick only one ETF. The lower standard deviation is great, but I think I can reach that point by composing a portfolio with individual selections of ETFs. The portfolio’s expense ratio can be justified, at least to some extent, by the excellent internal diversification and the very high turnover ratio. That turnover ratio is currently listed at 180%. Even though I don’t like high turnover ratios, I recognize that they do create more costs in running the ETF. I’m looking for a simple and stable ETF. While this one offers an appealing combination of lower standard deviation and moderate correlation, I don’t feel that the selection represents a superior position to what I can create. That’s the problem in a nutshell. The ETF did a solid job of diversifying, but it doesn’t seem to be a suitable replacement for an entire portfolio compared with just holding something like SPY. If an investor intends to hold several ETFs rather than one, then they can build the portfolio to their exact risk specifications. This ETF may be a great fit for any investors that want the exact risk factors the ETF has selected. The large yields and strong volumes may make the ETF much more appealing for retiring investors seeking strong yields for current income. For me, those benefits simply aren’t enough. Disclosure: The author has no positions in any stocks mentioned, and no plans to initiate any positions within the next 72 hours. (More…) The author wrote this article themselves, and it expresses their own opinions. The author is not receiving compensation for it (other than from Seeking Alpha). The author has no business relationship with any company whose stock is mentioned in this article. Additional disclosure: Information in this article represents the opinion of the analyst. All statements are represented as opinions, rather than facts, and should not be construed as advice to buy or sell a security. Ratings of “outperform” and “underperform” reflect the analyst’s estimation of a divergence between the market value for a security and the price that would be appropriate given the potential for risks and returns relative to other securities. The analyst does not know your particular objectives for returns or constraints upon investing. All investors are encouraged to do their own research before making any investment decision. Information is regularly obtained from Yahoo Finance, Google Finance, and SEC Database. If Yahoo, Google, or the SEC database contained faulty or old information it could be incorporated into my analysis. The analyst holds a diversified portfolio including mutual funds or index funds which may include a small long exposure to the stock.

Why I’m Buying Gilead And Selling Celgene

Summary Gilead appears very cheap compared to Celgene. In this article I compare growth expectations to valuation for the two companies. I think that a “pair trade” long Gilead and short Celgene makes sense at this time. Today I am starting a new mock portfolio on Seeking Alpha: the Pairs Trade Portfolio. Every transaction made in the portfolio will be a pair of trades of equal value (as close to $20,000 for each stock as can be), one long trade and one short trade. I plan on adding to this portfolio – and readjusting as necessary – over the next months and years and it will probably end up being a rather large study. The first trade is to go long Gilead (NASDAQ: GILD ) and short Celgene (NASDAQ: CELG ). My apologies for the length and description of this article. As it is the first in the series I will define and describe the strategy of pairs trading in detail here and refer to this page in future articles. Those readers familiar with the concept can skip over the next part and begin reading at the “Gilead vs. Celgene” section below. What is a “pair trade” and why would an investor want to do it? Pairs trading takes two highly correlated investment instruments and essentially pits them against each other. What stock will do better, Lowe’s or Home Depot? Pfizer or Merck? The investor goes long on the stock he/she thinks is undervalued relative to the overvalued one. The (relatively) overvalued one gets shorted. The investor is thus hedging bets and isolating a trade that only takes into account the relative value between two stocks. The strategy is often thought of as a very technical, statistics-driven exercise in which an outperforming stock is always shorted and the underperforming one is always the long. “Reversion to the mean” is counted on to make money in the pair trade. However, I feel that approach is short-sighted and I won’t be a slave to it. There are countless examples of stocks that outperform others consistently despite a high degree of correlation in the short term. Those are cases in which a pair trade with the underperforming stock as the long should be avoided. The motivation for making a pair trade is largely due to the fact that the strategy is a market-neutral hedge. It does not matter if the overall market crashes or zooms to new heights; the investor makes money if and only if the long stock pick outperforms the short stock pick. For example, let’s assume we set up a pair trade that is long Gilead at $100 per share and short Celgene at $120 per share and a market crash hits us in 2014. At the end of 2014, Gilead sits at $60 per share and Celgene goes to $60 as well. If the original position was $20,000 in each stock, then our pair trading investor has made $2,000 during 2014 (long GILD loses $8,000, short CELG gains $10,000) – a gain of 5% overall. Pairs trading is potentially a great defensive strategy. The market-neutral aspect of it makes it something to consider when it appears that stocks are overvalued in general. Pairs trading protects the investor from high valuations. Here’s a simplistic example: an investor believes that company A is a great company in a great industry. He/she really wants to invest in company A but the market is in the stratosphere and A sports a P/E of 70 – the risk seems to outweigh the reward. But he/she sees that company B, which has similar prospects to company A has a P/E of 110. The investor can go ahead and invest in company A as a pair trade with B and those P/E ratios might as well be 7 and 11, or 700 and 1100 for that matter. Recently I hear a lot of statements like “there’s nothing to buy”, “money has to be invested somewhere”, or “I’m afraid of valuations, but I don’t know what else to do but buy and hold.” At this point in time, I feel that every investor should consider any and every conservative strategy available. In my opinion, the US markets are in for a correction and I have written about the macro outlook a couple of times recently: One could think of a pairs trade strategy as another “what to do” when a bear market looks likely. Gilead vs. Celgene Both Gilead and Celgene are large biotech companies (market caps of about $157 billion and $96 billion respectively) and therefore it is not surprising that the correlation between the stock prices of the two companies was high during the past year: GILD data by YCharts A major divergence occurred recently – in early November – when Gilead started drifting lower/sideways while Celgene powered higher. On December 22, GILD took a fairly large plunge when Express Scripts (NASDAQ: ESRX ) announced that it would exclusively cover the AbbVie (NYSE: ABBV ) hep C drug. The question is, does that divergence mean that Gilead is undervalued compared to Celgene? The above chart suggests that might be the case and a further look is in order. I think that GILD is a better buy than CELG and the next sections will cover the growth prospects and valuation comparisons. Growth for Gilead The average analyst estimate for sales growth in 2015 is 17.8%. A quick look at where that growth will come from is in order to see if it makes sense. Estimates for worldwide growth in Sovaldi/Harvoni sales in 2015 are all over the map and while it is certainly difficult to guess where that will land, I’d say a conservative estimate is for 5% growth in sales. I’ve seen estimates from -5% to 30% growth. Sovaldi/Harvoni will likely account for more than half of Gilead’s total sales in 2015, but other drugs are growing fast and becoming more important for the company. In a previous article about Gilead, I noted that: According to Thomson Reuters, sales of idelalisib [Zydelig] are forecast to exceed $1 billion by 2017, with consensus sales forecasts of $1.218 billion that year. Zydelig began sales last quarter and it will be interesting to see how well it did in Q4 2014. It should add somewhere between $500 million to $700 million in 2015. In my article referenced above, I also singled out Stribild and noted that it was expected to see sales of over $2 billion in 2016. In 2014, it should easily clear the $1 billion mark. Like Zydelig, Stribild should also add a considerable amount to the top line. My estimate is an additional $700 to $900 million in 2015 sales. Complera/Eviplera is another in Gilead’s best-in-class HIV stable of drugs that is growing fast. In the first nine months of 2014, sales grew over 60% year to year and will eclipse the $1 billion mark for all of 2014. I expect it to add $500 to $600 million in sales to 2015 figures. A look at Gilead’s most recent 10-Q (see part 13. Segment Information) shows that the other drugs will likely be slightly up or slightly down. Add in any new approvals and there should be slight growth in the “other” category of those products that I did not mention above. Adding everything up (and making some assumptions for Q4 2014) puts my rather conservative 2015 revenue growth at about 12% – 14%. So by my back-of-the-envelope reckoning, the analyst expectations for 17.8% revenue growth look reasonable to me. Growth for Celgene Celgene’s growth is much easier to estimate as the company just gave guidance yesterday. Management expects 2015 revenue to grow 22.3% over 2014. Analyst estimates show a number of 21%, so it looks safe to assume something in the low 20s. Valuation I have recently written about Celgene’s GAAP and non-GAAP reporting in an article titled ” Celgene: Could You Be More Like Gilead, Please? ” and because I believe that the non-GAAP numbers inflate EPS, I will use GAAP figures for the P/E calculations below. Gilead should report EPS of about $7.25 for 2014. At a current stock price of $104.80, that equates to a P/E of 14.5. Celgene has reported EPS of $2.39 for 2014. At a current stock price of $119.16, that equates to a P/E of 49.9. Let’s take a look at cash generation: GILD Cash from Operations (TTM) data by YCharts Gilead’s market cap is about 60% higher than Celgene. However, it generates more than 300% cash than Celgene. The above chart shows the trailing 12 months, so once Gilead’s Q4 results are put into it, the figure will likely be something like 400% more cash from operations. Finally, a look at revenue: GILD Revenue (TTM) data by YCharts Again, Gilead’s soon-to-be-released Q4 results are not included. Once they are, the TTM sales number should be around $23 billion, or 200% higher than Celgene. Conclusion When we look at sales, earnings, and cash flow, we can see that Gilead is at a level anywhere from two to four times higher than Celgene. And yet the market cap of Gilead is only 60% higher than Celgene. 2015 growth estimates favor Celgene by 22.3% to 17.8%. Gilead’s incredible growth in 2014 will plateau and we will see good – but not exceptional – growth in 2015. For that reason, Celgene clearly does deserve a higher multiple, but not a multiple that is more than three times that of Gilead. I expect to see the difference in multiples between the two stocks narrow, thus favoring GILD in a pair trade. The Portfolio So here is what the mock portfolio looks like so far after executing the first pair trade: (click to enlarge) Not terribly exciting yet, but there will be more to come. Be sure to click “follow” if you would like to get real-time alerts on my future articles. Disclosure: The author is long GILD. (More…) The author wrote this article themselves, and it expresses their own opinions. The author is not receiving compensation for it (other than from Seeking Alpha). The author has no business relationship with any company whose stock is mentioned in this article.