Tag Archives: opinion

A Race Against Volatility And Bearish Sentiment For The United States Oil ETF

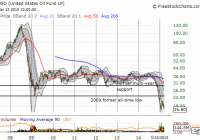
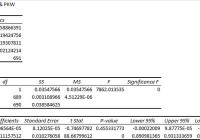
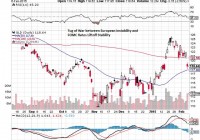
Summary Option-implied volatility on oil is at levels seen during the financial crisis, and short-term volatility on the United States Oil ETF has soared. While current momentum and fundamentals strongly favor the bears, it seems a recent large long-term bet against volatility is the best risk/reward trade on the United States Oil ETF. An analysis of the timing of various United States Oil ETF trades shows a strong bearish short-term opinion that is very reactive and a telling dispersion of longer-term opinion. On March 5, 2015, Barron’s Blogs published a short article on a large bet against volatility on the United States Oil ETF (NYSEARCA: USO ) called ” Big Options Bet Sees Oil ETF Rangebound into 2017.” The possibilities intrigued me because USO enjoyed a remarkable 5-year period of range-bound trading before the current plunge. After the bounce from 2009 lows, USO hit a high of around $46 in 2011 and a low of $29 once in 2011 and again in 2012. An extended period of relative tranquility has been rudely interrupted Directionless, long-term bets seem very reasonable especially given the runway allowed to close-out the trade at a profit well ahead of expiration. The key quote from the blog post: Energy-sector analysts continue debate the supply and demand picture, but one trader in the options market stepped up to the plate with a notably large, long-term wager oil stability. Andrew Wilkinson at Interactive Brokers noted the so-called ‘straddle’ position, which involved the simultaneous sale of ‘put’ options and ‘call’ options that expire way out in January 2017. Options are contracts that allow investors to buy or sell shares at a set price at a specific period of time. Selling options requires a bet against the underlying equity trading “in the money” by expiration. For call options, it is a bet that the underlying will close below the strike price plus the option premium. For put options, it is a bet that the underlying will close above the strike price minus the option premium. Selling BOTH call and put options on the same underlying is a bet that the underlying will stay within a range over time AND that volatility will generally decline over this time. If the underlying falls too far or gains too much too soon, losses could be great enough to force the trader to abandon the bet at a large loss. The Barron’s blog indicated that the big trade will work as long as USO remains within the range of $12.30/share to $25.70/share. It did not provide the specific strikes, so I directly reviewed the Jan 2017 strikes for large increases in open interest. After this process, I concluded that the swell of negative short-term bets combined with the dispersion of opinion on longer-term bets makes a directionless bet more intriguing. I used the options information in Etrade.com to look at the open interest on individual options as of the close Friday, March 13, 2015. The January 2017 calls with the largest open interest have strikes of $19 and $20 at 21,199 and 23,626 options, respectively. The January 2017 put options with the largest open interest have strikes of $19 and $20 as well at 20,178 and 17,975 options, respectively. There are no other strikes that even come close to these. Looking at the history of open interest, I found that the Jan $20 calls and Jan $20 puts have experienced steady increases in open interest since mid-January and early February, respectively. On the other hand, the Jan $19 calls and Jan $19 puts have both experienced large leaps in open interest. The open interest on the call options more than doubled to about 12,500 options on March 5th. The open interest on the put options went from a mere 2,500 or so to about 12,500 on March 5th. In both cases, traders have clearly piled into calls and puts on top of the initial surge – perhaps in imitation of the short straddle, perhaps as a result of differing interpretations on the implications for the large options trades. For reference, I looked at the other long-term options available for trading: the January 2016 expiration. Open interest in the January 2016 options is quite diverse. For call options, the top open interest sits at $25 with no other strike anywhere close to the 44,445 options. This is of course, right at the top of the range that the January 2017 trader is betting on. There are a cluster of call options ranging from 34,667 to 20,988 open interest scattered across $18, $20, $21, $28, $35 and $30 strikes in descending order. For put options, the $16 strike has an open interest of 52,625 with the $18 strike at a close second with 41,748 open interest. In the case of the call options, clearly some of the bets are very speculative. The calls at the $35 strike have been bought mainly in three separate chunks once in each of the months of November, December, and January at prices around $1.10, $0.45, and $0.17, respectively. So from the lens of individual options on a longer-term basis, the bets for or against USO represent a spread of market opinions. On a short-term basis, the opinion on USO is definitively negative although sentiment has hit even more negative levels before the big sell-off started. This sentiment has created substantial premiums on puts options. Schaeffer’s Investment Research calculates an open interest put/call ratio based on the options expiring within three months. It represents immediate market sentiment. The chart below shows three large spikes in the ratio; only the third turned out to be significant. Yet, traders still rapidly got more (relatively) bullish as the sell-off got underway. After hitting a major low, the ratio only tentatively stair-stepped its way higher until it finally soared in the past month AFTER USO made its last all-time low. The overall open interest put/call ratio stair-stepped tentatively until AFTER USO made its last major low In other words, the market only recently started to accept the bearish nature of the trading in USO as a result of the bearish fundamentals of on-going inventory builds and STILL rising production in oil (not to mention the contango conditions which promise to drag USO further down as the fund rolls over futures positions). Last week, Kuwait suggested that OPEC will continue its production policy in its upcoming June meeting. Also last week, the International Energy Agency (IEA) said …U.S. supply so far shows precious little sign of slowing down. Quite to the contrary, it continues to defy expectations. The organization does not expect production growth to slow until the second half of 2015. U.S. crude inventories are now at a record 468M barrels. (See Reuters ” IEA sees renewed pressure on oil prices as glut worsens” for more details on these developments). I suspect the issue of supply cuts will finally get forced when the marginal buyers of oil have to exit the market for lack of storage. At THAT point, perhaps some kind of sustainable bottom in oil will begin. In the meantime, the pressure on oil prices has created a surge in related measured volatility. The Bank of England recently published this spider chart showing option-implied volatility for oil is at levels seen during the financial crisis. Volatility across financial markets has expanded rapidly from last year’s levels – oil stands out as having reached levels of volatility equal to those of the financial crisis Schaeffer’s Investment Research calculates its own volatility index, the SVI, on individual equities. I believe it uses the front and second month options for its calculation . The SVI for USO has surged to tremendous highs but it has actually come off in recent weeks, likely a reflection of the relief from USO’s jump from recent lows. It took a while for the market to accept the tremendous downside potential on USO. The volatility index did not even reach a new high until the sell-off was about 3 months old. The volatility index on USO peaked just after its recent low. Source: Schaeffer’s Investment Research The behavior of the SVI suggests that the market in USO is very reactive rather than predictive. The extreme in the option-implied volatility on oil suggests that we are closer to the end than the beginning of the volatility spike in oil. If volatility measures on USO, like SVI, manage to make fresh highs, such a move could represent a final washout of negative sentiment. Time seems to be on the side of the big seller of the straddle on January 2017 options. Like the open interest put/call ratio, it took the failure of OPEC’s November meeting to prop up prices for USO shorts to get really serious. In other words, there was a lot of latent expectation (hope?) that OPEC would succeed in efforts to manipulate the market. Shares short on USO are now back to levels last seen in the summer of 2013. Note how that ramp evaporated quickly after USO declined mildly for a few months. Shares short on USO were sitting at a major low one month into the sell-off… Here is a close-up showing how fast shorts piled up after the OPEC late November meeting. For example, shares short soared over 50% from December 1 to December 15. …and shares short did not take-off in earnest until December (after OPEC could not decide to cut production to try to prop up prices) As of the time of completing this piece, USO cracked a new all-time low as WTI crude hit lows not seen since March, 2009. The mild optimism that built from the earnings reports of various oil companies has faded in the wake of the market realities that continue to pressure oil lower. United States Oil ETF makes a new (intraday) all-time low shortly after opening for trading on March 16, 2015 Source: FreeStockCharts.com As I mentioned earlier, I think a major market event like an actual decline in U.S. inventories or the complete filling of storage capacity might be required to signal a more sustainable bottom in oil prices. Ahead of that, selling long-term volatility while premiums are high could be the best risk/reward trade available on USO. Until a major market event, the shorter-term momentum looks firmly in favor of the bears. Be careful out there! Disclosure: The author has no positions in any stocks mentioned, but may initiate a short position in USO over the next 72 hours. (More…) The author wrote this article themselves, and it expresses their own opinions. The author is not receiving compensation for it (other than from Seeking Alpha). The author has no business relationship with any company whose stock is mentioned in this article. Additional disclosure: Note that I may open a short and/or long position on USO in the next 72 hours. See article for more details.

PKW Shouldn’t Be Able To Outperform SPY Reliably, But It Did

Summary I’m taking a look at PKW as a candidate for inclusion in my ETF portfolio. The risk level is reasonable and the correlation is high. The performance is surprisingly good. The liquidity is solid, so I expect the statistics to be reliable. Despite the higher expense ratio, the ETF has stacked up very well to SPY over the last several years. Investors should be seeking to improve their risk adjusted returns. I’m a big fan of using ETFs to achieve the risk adjusted returns relative to the portfolios that a normal investor can generate for themselves after trading costs. I’m working on building a new portfolio and I’m going to be analyzing several of the ETFs that I am considering for my personal portfolio. One of the funds that I’m considering is the PowerShares Buyback Achievers Portfolio (NYSEARCA: PKW ). I’ll be performing a substantial portion of my analysis along the lines of modern portfolio theory, so my goal is to find ways to minimize costs while achieving diversification to reduce my risk level. What does PKW do? PKW attempts to track the total return (before fees and expenses) of NASDAQ Buyback Achievers® Index. At least 90% of the assets are invested in funds included in this index. PKW falls under the category of “Large Blend”. Does PKW provide diversification benefits to a portfolio? Each investor may hold a different portfolio, but I use (NYSEARCA: SPY ) as the basis for my analysis. I believe SPY, or another large cap U.S. fund with similar properties, represents the reasonable first step for many investors designing an ETF portfolio. Therefore, I start my diversification analysis by seeing how it works with SPY. I start with an ANOVA table: (click to enlarge) The correlation is just under 96%. That’s a very high level of correlation and relatively unattractive for investors hoping for diversification benefits. As an investor using modern portfolio theory, I would prefer to see lower levels of correlation. Of course, the low value correlation wouldn’t mean much if the values were being distorted by poor liquidity. The average volume of nearly 500,000 shares per day suggests that liquidity shouldn’t be a concern. That’s a good sign for investors wanting verification of the statistics or wanting to know that they can exit the position with less concern about it deviating from NAV. Standard deviation of daily returns (dividend adjusted, measured since November 2013) The standard deviation is fairly reasonable. For PKW, it is .787%. For SPY, it is 0.748% for the same period. The ETF is definitely showing a little more volatility than SPY when we compare returns on a daily basis. Mixing it with SPY I frequently run comparisons on the standard deviation of daily returns for the portfolio, assuming that the portfolio is combined with the S&P 500. However, for PKW, I don’t think that adds much value. The correlation being nearly 96% really destroys the benefits of diversification. Why I use standard deviation of daily returns I don’t believe historical returns have predictive power for future returns, but I do believe historical values for standard deviations of returns relative to other ETFs have some predictive power on future risks and correlations. Yield and Taxes The distribution yield is 1.06%. I like to see strong yields for retiring portfolios, because I don’t want to touch the principal. By investing in ETFs I’m removing some of the human emotions, such as panic. Higher yields imply lower growth rates (without reinvestment) over the long term, but that is an acceptable trade off in my opinion. This ETF doesn’t have a high yield, but I am far enough away from retirement to be willing to work with the weaker yields. Expense Ratio The ETF is posting an expense ratio of .68%. That’s high compared to most of the ETFs that are appealing to me, but the expense ratio may reflect the premium being charged for the trading methodology the ETF is using to determine the positions within the ETF. Market to NAV The ETF is at a .06% discount to NAV currently. Premiums or discounts to NAV can change very quickly, so investors should check prior to putting in an order. Generally speaking, that discount to NAV isn’t big enough to be a big deal. However, even a small discount to NAV is fairly attractive when we are talking about a high quality ETF. Largest Holdings The diversification in the holdings isn’t going to be a strong selling point. (click to enlarge) Conclusion PKW was one of the most difficult ETFs to make a decision about. The ETF posts a very high correlation to SPY and a high expense ratio. Some screeners don’t have a portfolio turnover ratio for the ETF, but the prospectus states that in the last fiscal year the turnover ratio was 92%. I expect that kind of turnover to require some costs, but I generally don’t want to pay higher turnover ratios because my use of ETFs involves relying on markets to be reasonably efficient. If the markets are thoroughly efficient, then creating a proprietary trading system to select which positions to enter and which ones to end should not result in any reliable excess returns. However, history is providing some support for the methodology PKW is using. I was suspicious about their outperformance of SPY in the test period, so I extended my sample to a five-year period and looked at the returns on a time line. The result is that PKW outperformed SPY meaningfully over that five-year period. Looking at the lines, it isn’t a single period where PKW outperformed either. The fund’s performance has been strong and steady, which makes it appear more repeatable. I wanted to eliminate the ETF for the high expense ratio and relative weakness in diversification, but I can’t do it. Maybe it is just chance that eventually an ETF had to deliver this kind of strong performance over an extended period, but I won’t toss out an ETF that makes a fairly impressive case for itself without digging deeper. Disclosure: The author has no positions in any stocks mentioned, and no plans to initiate any positions within the next 72 hours. (More…) The author wrote this article themselves, and it expresses their own opinions. The author is not receiving compensation for it (other than from Seeking Alpha). The author has no business relationship with any company whose stock is mentioned in this article. Additional disclosure: Information in this article represents the opinion of the analyst. All statements are represented as opinions, rather than facts, and should not be construed as advice to buy or sell a security. Ratings of “outperform” and “underperform” reflect the analyst’s estimation of a divergence between the market value for a security and the price that would be appropriate given the potential for risks and returns relative to other securities. The analyst does not know your particular objectives for returns or constraints upon investing. All investors are encouraged to do their own research before making any investment decision. Information is regularly obtained from Yahoo Finance, Google Finance, and SEC Database. If Yahoo, Google, or the SEC database contained faulty or old information it could be incorporated into my analysis. The analyst holds a diversified portfolio including mutual funds or index funds which may include a small long exposure to the stock.

Hold GLD In The Tug Of War Over Financial Stability In 2015

Summary Refuted the recent market doubt of FOMC liftoff in 2015 introduced by Warren Buffett with 3 sources. They are opinions of FOMC voter, San Francisco Fed’s John Williams, strong January 2015 labor data, and influential centrist James Bullard from St. Louis Fed. Current low interest rate environment is put into perspective, and rate hikes will contribute to financial stability in the U.S. Currently, there is a tug of war for financial stability with the U.S. contributing to financial stability and Europe contributing to financial instability. Investors should continue to hold on to GLD even as financial stability has the upper hand this month as the global situation remains fluid and uncertain. Buffett’s Doubt About FOMC Liftoff Famed billionaire investor Warren Buffett has thrown into doubt the feasibility of the first Fed rate liftoff in mid-2015 in a recent interview with CNBC . Buffett makes the point that with the world in trouble, the higher U.S. rates will pull funds into the U.S. and somehow destabilize the global economy. Given the status of Warren Buffett, it is likely that a significant size of the market will be influenced by his opinion. In this article, I am going to look at the possibility of a rate hike in mid-2015, which is the wide market consensus, through 3 different sources. The first source would be the interview which San Francisco Federal Reserve President John Williams had with Steve Liesman of CNBC. John Williams is a voting member of the Federal Open Market Committee (FOMC) this year and has greater influence on monetary policy. It is to be noted that FOMC Chair Janet Yellen was the President of the San Francisco Fed before her ascendancy to FOMC Governor and her current position as Chair of the Fed and FOMC. The second source would be the latest labor market conditions released by the Department of Labor last Friday on 06 February, 2015, for January 2015. This has a high impact on the decision of the Fed to raise rates as part of its employment mandate. The third source would be St. Louis Fed President James Bullard’s essay for the Regional Economist last month. While Bullard is not a voting member of the FOMC this year, he is an influential member of the FOMC and has held his current position from March 2011. Research by Macroeconomic Advisers has showed that Bullard has the most impact on the bond market among all Fed policymakers in 2013. He even outshines the then Fed Chairman Ben Bernanke on an overall basis, but Ben has more influence on a per speech basis. This is due to his position as a policy centrist and his ability to move the FOMC as seen in this Boston Journal article. Hence, his views are an integral part in the analysis of the timeline of the possible rate liftoff. San Francisco Fed’s View of Rate Liftoff San Francisco Fed President John Williams had the CNBC interview recently on 30 January, 2015. Steve Liesman asked the question that is on everyone’s mind, and I reproduce it below (exactly as it appears on the site) for your reference: “LIESMAN: SO DOES ALL THAT KEEP YOU ON TRACK FOR WHAT YOU HAD SAID EARLIER, WHICH IS A MID-2015 FIRST RAKE HIKE, OR LIFT-OFF OF THE FED? WILLIAMS: SO MY CURRENT VIEW AND THIS IS, OF COURSE, MY VIEW. I’M NOT SPEAKING FOR MY COLLEAGUES. IT’S THAT AROUND THE MIDDLE OF THIS YEAR IS THE TIME THAT I THINK IN MY VIEW THAT WE’LL BE GETTING CLOSER TO THE SHOULD WE RAISE RATES NOW OR SHOULD WE WAIT A LITTLE LONGER, COLLECT SOME MORE DATA, GET MORE CONFIDENCE IN THE FORECAST? MY VIEWS ARE BASICALLY THE SAME AS THEY HAVE BEEN FOR THE LAST FEW MONTHS. THE ROUND MIDYEAR IS A GOOD GUESS. FOR WHEN WE REALLY ARE GETTING CLOSE TO THAT POINT, THAT RAISING RATES WILL BE APPROPRIATE. I’M NOT PREDICTING THAT IT WILL BE JUNE OR ANY PARTICULAR MEETING. BUT I THINK WE’RE GETTING CLOSER TO THAT POINT.” Williams had made it clear that he would expect the FOMC to lift rates in mid-2015. Liesman did quite a comprehensive interview with Williams and talked about the issues of employment (which we will revisit again later with the latest report) and inflation. The short story is that Williams has repeated the standard FOMC view that this period of low energy prices is transitory and the Fed has to see past that. His view is that after the end of 2016, this transitory period would have passed and inflation will return to the 2% inflation target. Strong January 2015 Labor Data As for the employment data, Williams predicted a strong economy growing at 3% this year, along with a tight labor market. For 2014, Williams mentioned that the U.S. added, on average, 250,000 jobs per month, and this is strong growth. He would not expect such a strong employment growth this year. If so, he will be pleasantly surprised by the latest January 2015 labor data last week. The Department of Labor reported that the U.S. added 257,000 jobs last month over market consensus of 236,000. This is good news even if it came in lesser than the revised 329,000 for December 2014. In a sign of tight labor market, the average hourly pay rose 0.5% with significant job gains in the retail trade, construction, healthcare, financial services and manufacturing sectors of the economy. The slight increase in unemployment rate was due to 2 factors. The first is a technical readjustment due to new census data collected last year. The second reason is more encouraging because the strong economy has encouraged 155,000 discouraged workers to reapply for jobs. This expanded the labor pool in the U.S., and this is why this is good news despite the slightly higher unemployment rate. Taken together, recent data would encourage the Fed to raise rates at an earlier date. One point to note is that there are some who see the headline growth of 2.6% for the fourth quarter as a disappointment because it is a sharp difference from the 5% figure of the third quarter. However, one should note that the Bureau of Economic Analysis report shows that there was strong growth in consumption, which is 70% of U.S. GDP. It is greater consumption of foreign goods which pushed down net export that caused the relative weakness in the last quarter’s GDP growth. St. Louis Fed’s Support for Liftoff Lastly, I put in Bullard’s view into my analysis of the possible rate liftoff. Bullard penned the following essay titled ” Liftoff: A Comparison of Two Normalization Cycles ” for The Regional Economist last month. He compared the liftoff from September 1992 to February 1993 with rates at 6% to the later liftoff from June 2004 to June 2006 with rates at 5.25%. He described the first liftoff as disorderly and data dependent and the second liftoff as orderly but not market dependent. The disorderly first liftoff with a mixture of 25, 50 and 75 basis point rate hike resulted in a strong and robust economy at the cost of turmoil in the bond markets. The second liftoff was orderly at 25 basis points throughout with consideration for the economic data, but it weakened the economy as low interest rates resulted in a housing bubble, along with lax oversight which burst in 2007. There are 2 things to note in the Bullard’s essay. First, he makes no mention over possible reasons for the Fed not to raise rates this year. In fact, the question is not if the Fed will raise rates, this is a given. The question is how should the Fed raise rates in the most effective way for good economic growth. The second point is more subtle but relevant. Bullard has made the point indirectly that for the sake of financial stability in the U.S., the U.S. should be prepared to take the pain of higher interest rates. It was low interest rates that led to the 2005 housing bubble in the first place, and when it burst, it resulted in a world of pain not only for the U.S., but also the whole world when Lehman Brothers collapsed along with it. There is this central contention that higher interest rates will lead to higher and quality economic growth, and the best way to do so is to raise rates with clear communications to the market. This is the lesson learnt in the 2 rates normalization exercises since 1992. Putting it into Perspective This point of financial stability brings me back to the original point made by Warren Buffett and eventually gold. My opinion is that it is true that the higher interest rates in the U.S. will attract funds to the U.S., and troubled places like Europe, Japan and emerging markets might be adversely affected. There is this view that if the world doesn’t do well, the U.S. will not do well either. However, this is a rather moot point because the funds will want to leave troubled economies in one way or another. The bright spot of the U.S. economy will give these funds a clear destination instead of it being channeled into other asset classes and cause unintended consequences such as a housing bubble. To keep current U.S. interest rate environment in perspective, I quote Williams again (exactly as it appears on the site) from the interview: “LIESMAN: BUT IF INFLATION IS NOT MOVING TOWARDS YOUR 2% TARGET, IF WAGES AREN’T MOVING UP OR ANYTHING CLOSE TO THAT 3% OR 3.5% TARGET, WHY WOULD YOU BE RAISING INTEREST RATES AT THAT TIME? WILLIAMS: WELL I THINK TWO POINTS I WOULD LIKE TO GET ACROSS. FIRST OF ALL, WE ARE GETTING PRETTY CLOSE ALREADY BY THE MIDDLE OF THIS YEAR IN MY VIEW TO FULL EMPLOYMENT. IN OUR EMPLOYMENT MANDATE, I THINK WE’LL BE CLOSER TO ACHIEVING THAT. THE SECOND IS WE HAVE TO REMEMBER WE’RE STARTING FROM A POSITION WITH EXTRAORDINARY MONETARY ACCOMMODATION. WE HAVE ZERO INTEREST RATES, WHICH MEANS NEGATIVE INFLATION ADJUSTED INTEREST RATES. AND OVER A $4 TRILLION BALANCE SHEET. I’M NOT TALKING ABOUT NORMALIZING MONETARY POLICY OR EVEN TIGHTENING POLICY IN A WAY. I’M TALKING ABOUT STARTING TO PROCESS WHERE WE TRIM BACK SOME OF THE EXTRAORDINARY ACCOMMODATION WE HAVE IN PLACE.” I have taken the liberty to underline the most important point in the quote and the rest is to put some context into the quote. This shows that from the Fed’s perspective, this is merely about trimming back the extraordinary monetary accommodation that is long overdue, and this is not as drastic as the market would make it out to be. It should also be noted that the FOMC statement has considered international developments when it issued the bullish statement last month which anchors the mid-2015 rate lift-off expectations. Financial Stability Tug of War Of course, there is the more valid point that it is the opinion of the FOMC voting member that will count in the end result of the actual rate liftoff. After going through these 3 sources, investors should be convinced that rate hikes are likely to be anchored in mid-2015. This is likely to contribute to the financial stability in the U.S. While the current Greek debt drama in Europe is a drag on financial stability, the intention of the FOMC to lift rates is a strong anchor to financial stability. My view is that inflation has a lesser influence on gold prices when compared to the issue of financial stability. The actions of the FOMC will put a floor to the price of gold due to the stability it provides, and funds leaving Europe will find safe harbor in the deep US market. This tug of war between forces of instability in Europe and stability in U.S. is now being pulled in the direction of the U.S. Simply put, the market has priced in the Greek drama last month which saw the sharp gains in gold. This month, the game of brinkmanship is being played out between Greece and the Troika in full public display, but it is unlikely to move the markets much despite the amount of drama generated in the process. This is because the Eurozone is much more prepared to handle the mess of a Grexit with its various backstop mechanisms. Right now, the market assumption is that even if the negotiations fail and Greece has to leave, these backstop mechanisms will be sufficient to absorb the impact. Of course, these assumptions can change as this is a fluid and dynamic situation which will affect other bigger debtor countries like Portugal and Italy. The fallout for these countries is harder to contain. GLD as a Hedge Against Financial Instability (click to enlarge) There are many ways to gain exposure to gold, but my recommendation would be to use the SPDR Gold Trust ETF (NYSEARCA: GLD ) as it is the most liquid Exchange Traded Fund (ETF) for gold exposure with a market capitalization of $30.70 billion and transaction volume of 13 million. We can see from the GLD chart above, the appreciation of GLD from $112 to $126 in January 2015. This 12.5% rise is the market pricing in the European instability, and the subsequent decline from $126 to $118 now reflects the strong economic growth of the U.S., especially the strong labor market data last Friday as mentioned earlier. This has increased the possibility of an earlier rate liftoff by the Fed, which will contribute to greater financial stability in the world. The big question is whether GLD can hold the resistance at $117. Given the instability in Europe, my view is that the $117 resistance level will be a difficult level to cross. However, it is clear that financial stability will have the upper hand this month as the deadline for the Greek debt negotiation is until 28 February, 2015, even if there are pressures to push forward that deadline. As long as both sides are still talking, we can assume that things will be contained at least for this month no matter how drastic the media will make it out to be. In any case, investors should continue to hold GLD in their portfolio and withstand the inevitable volatility in this tug of war over financial stability. Over a longer-time horizon, it is unclear which side will prevail. Hence, it would be a wise decision to hold on to GLD until the situation clarifies itself. Disclosure: The author has no positions in any stocks mentioned, and no plans to initiate any positions within the next 72 hours. (More…) The author wrote this article themselves, and it expresses their own opinions. The author is not receiving compensation for it (other than from Seeking Alpha). The author has no business relationship with any company whose stock is mentioned in this article.