The Best Gold Fund To Own
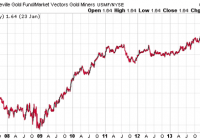
Summary Gold miners have unique situations due to differing geographic, regulatory and currency risk, as well as different ore quality. Gold mining index ETFs are good for trading and short-term exposure. Long-term investors who plan on holding longer than three months should consider TGLDX instead. Investors have flocked to index funds and ETFs due to their low cost, tax efficiency and transparency. The general rise of indexing has helped ETFs grow rapidly, taking market share from mutual funds, particularly actively managed funds. However, there are clear-cut cases of active managers outperforming their indexed competition. One example is the gold mining sector. Gold Funds Since the inception of the Market Vectors Gold Miners ETF (NYSEARCA: GDX ) in 2006, the fund has seen an incredible inflow of funds, to $7.1 billion as of January 23. The small cap edition, Market Vectors Junior Gold Miners ETF (NYSEARCA: GDXJ ) has amassed $2 billion in assets since its inception in late 2009. The actively managed the Tocqueville Gold Fund No Load (MUTF: TGLDX ), which was created back in 1998, has attracted only $1.3 billion in assets. For short-term investors, the ETFs make sense due to TGLDX’s short-term trading fee of 2 percent. The high volume in GDX and GDXJ indicates traders are using the ETFs to speculate on the volatile sector, even after a long bear market in mining shares. However, long-term investors may also be holding shares. Those investors are placing their confidence in the market cap-weighted indexing strategy, but the gold mining industry is one where active management can pay off. The saying “A mine is a hole in the ground with a liar at the top” is attributed to Mark Twain, and it gets to the heart of the difficulty in evaluating mining companies. The track record of TGLDX shows that this assumption is correct. The chart below is a price ratio of TGLDX to GDX – a rising line shows outperformance by TGLDX. (click to enlarge) Since its inception in 2006, TGLDX has generally outperformed GDX. Aside from an 18-month period from summer 2007 to 2009, TGLDX hasn’t spent much time trailing GDX. The total return since May 16, 2006, the inception of GDX, shows that TGLDX has built up a considerable lead: a loss of 4.46 percent versus a decline of 38.13 percent in GDX. (click to enlarge) TGLDX does have an advantage over GDX in that manager John Hathaway can choose to hold more small cap miners than the market cap-weighted index. However, TGLDX also beat GDXJ since the inception of that ETF, a loss of 33.12 percent versus a drop of 68.07 percent for GDXJ. This indicates stock selection is playing a role in TGLDX’s outperformance. (click to enlarge) The strong performance in TGLDX has more than made up for its higher expense ratio of 1.36 percent, versus 0.53 percent for GDX and 0.58 percent for GDXJ. TGLDX Recognized by Lipper as the Best Fund in the Precious Metals category during the last five years, the Tocqueville Gold Fund is co-managed by John Hathaway and Doug Groh. Originally created in 1998 by Mr. Hathaway, the fund was initially designed to take advantage of the negative psychology that surrounded the gold market at that time. The no-load fund is based on a contrarian value investment philosophy, and seeks long-term capital appreciation. The minimum investment is $1000 ($250 IRA). In addition to the 1.36 percent expense ratio, there is a 2 percent fee on shares held less than 90 days. This is not a fund for traders, but for long-term investors who want exposure to gold mining shares. Mr. Hathaway, senior managing director at Tocqueville Asset Management, is the portfolio manager for the Tocqueville Gold Fund. In 1986, he founded Hudson Capital Advisors and managed the firm until 1997, when he joined Tocqueville. Mr. Hathaway earned his B.A. From Harvard University, M.B.A. from the University of Virginia and began his career in 1970 employed as an equity analyst with Spencer Trask & Co. As portfolio manager for the Tocqueville Gold Fund, he searches for companies in the gold sector that have excellent management teams and assets that provide the most value independent of the price of gold. Researchers for the fund follow the entire gold resource and mining industry. Investing in the gold sector from 1998 to 2011 produced record returns. Since then, the sector has been out of favor and has taken quite a hit. Spot gold traded at a high above $1,900 an ounce in 2011, and finally found a bottom below $1,200 an ounce in 2014. Mr. Hathaway believes that the slump may be close to reversing for gold investors, and holds that a bottom in gold is being formed. Mr. Hathaway believes that the price of spot gold has been discounted to a point where most of the negative headlines are priced in. At some point, rates will need to be taken higher, and this could prove to be very disruptive to the markets. Back in November, he saw gold rallying along with the U.S. dollar as a sign of alternative reserve currency risk . The recent performance of gold in euros shows he was on target with this view. (click to enlarge) Finding Winners Aside from a 12 percent position in physical gold, the $1.3 billion fund is mostly invested in equities related to precious metal mining. While this sector can be challenging, Mr. Hathaway has a knack for discovering hidden gems involved with exploration and building up production. Gold mining is a capital-intensive business that takes many years to develop and will see many different issues over those years. An obvious change is in the price of gold, but companies in the gold sector must also deal with change in governments, currency devaluations, central bank policy and both local and global economic conditions. The fund takes a diversified approach and invests in all types of business models, ranging from royalty companies to businesses involved only in exploration. Speaking about the fund’s strategy, Hathaway said: “Our strategy for the Fund has been to find companies that are adding value even in a low gold price environment. As a result, we tend to focus on smaller companies and steer clear of larger companies that have either experienced operational challenges or have lower levels of reserves in their portfolio. We believe having smaller companies in the portfolio has been an important contributor to the Fund’s outperformance relative to its benchmark and the Morningstar Equity Precious Metals Funds Category over time.” The top five holdings behind the 12 percent holding in physical gold are Royal Gold (NASDAQ: RGLD ), Franco-Nevada (NYSE: FNV ), Eldorado Gold (NYSE: EGO ), Goldcorp (NYSE: GG ) and Agnico Eagle Mines (NYSE: AEM ). Allocations in the top ten range from 6.62 percent in Royal Gold to 3.19 percent in Yamana Gold (NYSE: AUY ). Recent underperformance by Eldorado and Yamana have dinged the fund in 2015. The fund is up 11.06 percent through January 23, versus a 15.42 percent return for GDX. Royalty companies play a major role in the fund, with about 12 percent of its assets invested in two of the major players: Royal Gold and Franco-Nevada. The business model that royalty companies are based on has become attractive to gold investors. Gold royalty companies help finance mining construction and receive royalty payments in return. By investing this way, they avoid some of the hazards and costs of exploration or operations. The stream of payments that gold royalty companies receive are based on future sales, and are not as sensitive to spot gold price fluctuations. Mr. Hathaway recognized the inherent value of these type of investments early on and included them in TGLDX. Gold’s price decline in the last 3 years has been devastating for many gold mining companies. While some are specialized in exploration, others have expertise in development. Many in the niche are having to rethink their business models and capital spending plans in order to become profitable. This has led to an increase of mergers and acquisitions in the industry, and presents the fund with the ability to invest in companies that may be targeted acquisitions. In fact, the fund performed well in 2014, beating the category by more than 6 percent, by holding a large position in Osisko Mining Corp. ( OTC:OKSKF ). It became a top-weighted position in the fund until going through its merger . Another possible acquisition target that has been placed in the fund’s portfolio is based in Ontario, Canada. Detour Gold Corp. ( OTCPK:DRGDF ) is expected to become the largest operating gold mine in Canada, with a possible lifespan of 21 years. With Osisko Mining being acquired, investors began looking for the next target for a merger. Mr. Hathaway believes there will be more opportunities such as these, and continues to scour the landscape for possibilities. With around 17 years at the helm of the Tocqueville Gold Fund, Mr. Hathaway has his pulse on the gold sector and possesses a management style that’s been beneficial to its investors. TGLDX has beaten the returns of popular gold ETFs, and investors looking to establish a long-term position in the sector should look to the fund. Outlook for Gold Mining Shares In many foreign currencies, gold is experiencing a strong rally, trading at a 12-18 month high, depending on the currency. Gold is near its all-time high in yen, and at all-time highs in currencies that crumbled last year, such as the Russian ruble. If gold remains an alternative to the U.S. dollar as a reserve asset/safe haven currency, the price could remain elevated even amid a U.S. dollar bull market , since such a bull market will likely be accompanied by a series of financial or currency crises in emerging markets due to the run-up in dollar-denominated debt over the past several years. Falling energy prices, along with other costs for mines located abroad could help miners increase non-dollar profits. For example, in January alone, gold went from $1400 to $1600 in Canadian dollars. A 20 percent combination move in gold and Canadian dollar depreciation would lift the metal to a new all-time high in Canadian dollars. A pullback in gold and rebound in foreign currencies is long overdue, though, at least in the short run. Miners used the recent jump in prices to raise cash as well. The industry diluted shareholders to the tune of more than $800 million in January 2015 alone. The share issuance sent shares of the affected miners lower, and until business conditions for the sector improve markedly, further share issuance is possible. The best-case scenario for mining shares amid a U.S. dollar bull market (leaving aside a new bull market in the U.S. dollar price of gold) is if foreign demand for hard money keeps the price of gold level or even increases it slightly in U.S. dollars. The price in foreign currency could rise substantially as foreign currencies devalue versus the dollar and gold, and since mining shares are leveraged to the price of gold, their earnings could rise significantly. If, instead, the gold price falls, high-cost miners will struggle to remain profitable and the bear market for mining shares will continue.

