Tag Archives: open-xhr-start

Dominion Resources Set To Grow At Better Pace Than Its Peers

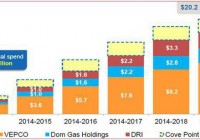
Summary Ongoing efforts to extend and improve operations will grow future top and bottom-line numbers. Company’s healthy earnings growth prospects will support cash flow base. D offers cheaper growth as compared to peers. Dominion Resources (NYSE: D ), one of the largest U.S. utility companies, has extended operations across the Mid-Atlantic region. D’s diversified electric and natural gas operations have been getting better revenue and earnings growth. As the company is increasing its growth capital expenditures to grow both electric and natural gas businesses, D’s long-term earnings growth outlook looks stable and attractive. And in fact, significant growth potential as a result of capital expenditures makes me believe the company will continue to grow its dividends at a healthy pace in the long term. The company’s earnings are expected to grow at an average rate of 6% in the next five years. Along with healthy growth prospects, the stock offers an attractive dividend yield of approximately 3%, which makes it an attractive pick for dividend-seeking investors. Elevated Growth Capital expenditure will guard D’s Long-Term Growth The U.S. utility sector has performed pretty well in 2014. And in the wake of improving economic conditions, future growth prospects of the industry also look bright. As far as D is concerned, with ongoing increases in its growth capital expenditures directed towards betterment and extension of its infrastructure and operations, the company has been strengthening its position among other utility sector giants. And in this regard, D has recently increased its long-term capital expenditure outlook from 2014-2019; the company will now spend $20.4 billion (guidance mid-point), higher than the previous forecast of $14 billion , on its various energy infrastructure projects. The value of these growth investments lies in strengthening the company’s current energy infrastructure in order to serve its customer base in a more competent and effective way. The following chart shows updated figures for the company’s increased capital expenditure on various growth projects. (click to enlarge) Source: Investor’s Meeting Presentation As natural gas production has significantly increased in the U.S., D is directing the major chunk of its capital expenditure to improve its natural gas infrastructure. As a matter of fact, one of the most important growth projects of the company is the Atlantic Coast Pipeline (NYSE: ACP ) project, which is a joint venture of D, Duke Energy (NYSE: DUK ), Piedmont Natural Gas Company (NYSE: PNY ) and AGL Resources Inc. (NYSE: GAS ). The ACP project’s pipelines, which have a capacity of 1.5Bcf/day, expandable to 2Bcf/Day, are waiting for FERC approval. The project’s construction is expected to begin in mid-2016, after which it will be made available for commercial operations by the end of 2018. D has the largest stake of 45% in the project, and I believe the company will benefit from this $5 billion project in the long run by meeting the increased natural gas transmission demand in Virginia and in North Carolina. Also, the company has invested $500 million towards its 1.0-1.5Bcf/day Supply Header Project (NYSE: SHP ). The timing to start SHP operations has been perfectly linked to the ACP project in order to support ACP by connecting its pipelines with five supply header reception points. With their operations scheduled to start in 2018, ACP and SHP will deliver natural gas to Virginia and North Carolina. In fact, these projects will allow D to increase its rates, which will portend well for its top and bottom-line growths in the long term. In addition to the ACP and SHP projects, the company has also agreed to acquire CGT for its subsidiary Dominion Midstream Partners, LP (NYSE: DM ). The addition of CGT offers an appealing opportunity to DM to raise rates in Virginia and Carolina, which will portend well to improve the company’s overall earnings base in the years ahead. Furthermore, the company is actively working to capitalize on the growth potentials of its Cove Point LNG export project, which has a capacity of 5.25 million tons/year . The Cove Point terminal facility is the first LNG export facility outside Louisiana and Texas to get government permission to export LNG. And it has created D’s monopoly, which will allow the company to enhance its bargaining power with suppliers. The company has already signed a 20-year LNG supply contract with Japan’s Sumitomo Corporation and Gail India. Owing to the longevity of these contracts, I believe D will have secure and strong top and bottom line bases for the years ahead. In addition to the abovementioned projects, the company is also making investments in renewable energy projects to strengthen its energy portfolio and comply with environmental regulations. In this regard, D has acquired the 28.4MW West Antelope Solar Park and the 50MW Pavant Solar Project . In its attempts to further capitalize on the growth prospects of renewable energy projects, the company has recently filed a request with VSCC to construct the first and largest solar facility in Virginia. By facilitating its customers to purchase electricity from its 2MW solar energy facility in Virginia, the company has created another important revenue generating source. Due to the impressive capital expenditure outlook and healthy growth prospects of the ongoing projects, I believe D is well-headed to delivering EPS growth in high-single digits. The company is scheduled for the 4Q’14 earnings call early next month, and during the earnings call, D will update its capital expenditure outlook and provide 2015 earnings guidance; any increase in capital expenditure outlook will portend well for its future growth and stock price. Hefty Dividends D’s healthy growth prospects have been fueling its earnings and cash flow growth, and helping it make attractive dividend payments to shareholders. Owing to its strong track record of making hefty dividend payments, the company is currently offering an attractive dividend yield of 3% . Since D is aggressively pursuing growth opportunities by making capital expenditures, I believe the company will attain more cash flow stability in the years ahead. Also, the company will continue to grow its dividends at a healthy pace in the years ahead; in the last five years, the company increased its dividends at an average rate of 7.3% . Risks The company’s efforts to expand its business operations, if not handled and executed effectively, could result in mismanagement and could weigh on its future performance. Moreover, regulatory restrictions and unfavorable movements in commodity prices are key risks to its future stock price performance. Conclusion The company’s ongoing efforts to extend and improve its operations are well-headed to grow its future top and bottom-line numbers. Moreover, the company’s healthy earnings growth prospects will support its cash flow base, which will allow it to consistently grow its dividends. The company currently has a higher forward P/E of 21.15x , as compared to Duke Energy’s and Southern’s forward P/E of 18.60x and 18.20x , respectively. I believe the higher forward P/E of D is justified due to its better growth prospects, as shown below in the table. Also, the company offers cheaper growth as compared to its peers, as it has a lower PEG of 2.9 , as compared to DUK’s PEG of 3.5 and SO’s PEG of 4.5 . The following table shows that D’s future earnings growth rate remains better than its peers. 2015 2016 2017 Long-Term 5-Year D 8.77% 4.80% 6.11% 6.05% DUK 3.97% 4.34% 5.27% 4.76% SO 2.13% 3.66% 4.31% 3.63% Source: Nasdaq.com
ALPS Plans A Put Write ETF To Play Market Volatility

The U.S. markets have seen a volatile start to the year, thanks to the relentless slide in crude oil prices, worries about a possible exit of Greece from the Euro zone, global economic growth concerns and slumping commodity prices. Rising market volatility has led some issuers to plan for funds based on put write strategy. WisdomTree has lately filed for a fund – WisdomTree CBOE S&P 500 Put Write Strategy Fund – to generate returns by writing put options on the S&P index. Most recently, ALPS has filed for a fund based on a similar strategy. The proposed fund will go under the name of ALPS Enhanced Put Write Strategy ETF (Pending: PUTX ). Below, we have highlighted some of the key details of the recently filed fund. PUTX in Focus As per the SEC filing , the proposed actively managed product looks to maximize total return by selling put options on the SPDR S&P 500 Trust ETF (NYSEARCA: SPY ). SPY tracks the S&P 500 index measuring the performance of large-cap U.S. stocks. The premium received will then be invested in an actively managed portfolio of investment grade debt securities. The portfolio will include Treasury bills, corporate bonds, commercial paper and mortgage- and asset-backed securities, having an average duration of less than 6 months and maturity of less than one year. How might it fit in a portfolio? The fund is a good choice for investors who wish to add income and thereby boost risk-adjusted returns. Investors who believe that the U.S. equity market will trade in a narrow range next year can look to invest in the fund. A put write strategy usually outperforms the index in a down trending market and significantly outperforms the S&P 500 index in a sideways market. Moreover, put write strategies have historically outperformed buy strategies. However, investors should keep in mind that the fund’s potential return is limited to the amount of option premium it receives and that the proposed fund might underperform during strong bull markets. ETF Competition The recently filed product is quite similar in strategy to the WisdomTree CBOE S&P 500 Put Write Strategy Fund. However, unlike PUTX. which sells options on SPY ETF, WisdomTree’s product looks to sell options on the S&P 500 index itself. Moreover, while PUTX looks to invest the premium received in an actively managed portfolio of investment grade debt securities with less than one year maturity, the CBOE S&P 500 Put Write Strategy Fund will invest the premium received in one-to-three month U.S. Treasury securities. As such, both the funds might be good competitors if launched. Apart from this we also have another put-write fund in the market from ALPS itself. The fund in question – US Equity High Volatility Put Write Index ETF (NYSEARCA: HVPW ) – tracks the NYSE Arca U.S. Equity High Volatility Put Write Index. The index sells put options on the largest capitalized stocks having the highest volatility. The index uses the sales proceeds to invest in short-term U.S. Treasury securities. The fund manages an asset base of $50.8 million and trades in low volumes of roughly 23,000 shares a day. The ETF charges 95 basis points as fees and has delivered flat returns in the year-to-date frame. So, there is hardly any competition for the newly proposed fund. If launched, the fund has a fair chance of making a name for itself. However, let’s not forget that success over the longer run is ultimately a huge factor of the fund’s performance.

Parallels Between The 1997 Asian Financial Crisis And U.S. Growth Today

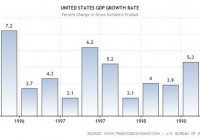
Richmond Fed President Lacker has reminded us of the U.S. recovery in 1997 and 2003 in the face of overwhelming Asian economic troubles. The lesson of the Asian Financial Crisis is briefly recapped with the actual impact on U.S. growth and inflation shown. After the U.S. recovered in 2010, it is European Sovereign Debt Crisis which darken the economic cloud but this shouldn’t derail us from the bigger economic picture. SPY with its collection of big chip companies like AAPL and XOM would be an excellent vehicle to ride the U.S. recovery. SPY has paused in its price range as European woes prevent its raise but this should not be the case for long. Potential catalyst for SPY is stated. I quote the following from Richmond Federal Reserve President Jeffrey M. Lacker during his speech earlier this month to the Virginia Bankers Association and Virginia Chamber of Commerce. The economic outlook can change rapidly, and judgments about appropriate policy need to respond accordingly. It’s not hard to find historical examples: The outlook for real activity shifted dramatically from late 1998, when overseas turmoil was thought to jeopardize U.S. growth, to early 1999, when it became clear that the effects would be minimal and activity was accelerating. Similarly, the outlook for growth and inflation shifted significantly from mid-2003, when inflation seemed to be sinking below 1 percent, to early 2004, when growth and inflation were clearly rising. Arguably, the Fed fell at least somewhat behind the curve in each case. President Lacker provided a very good example of the recency bias where people tend to focus on the recent events to the extent where they are too absorbed to look into the future. The 1997 Asian Financial Crisis and the 2003 SARS health crisis hit Asia which resulted in concerns over growth in the United States which were blown out of proportion. There are draw parallels with the economic situation today if we replace Asia with Europe as the economic source that is dragging down the U.S. It would be instructive to look at the actual economic growth and inflation in the U.S. during this period. This is the best example for the Fed’s insistence that low energy prices are transitory in nature and the need to see the bigger picture and to get ahead of the curve. 1997 Asian Financial Crisis The 1997 Asian Financial Crisis started in Thailand where speculators were successful in pushing down the value of the Thai baht to the point where it became virtually worthless. Other Asian countries follow suit to devalue their currencies to protect their vulnerable export sector with the notable exception of Malaysia which implemented currency control. Hot capital flows fled Asia and growth in the U.S. was negatively impacted as seen in the chart below before and after the crisis. (click to enlarge) If we were to look at these growth numbers with today’s eyes, it will look like a pretty solid growth trajectory to us. Then again, we have to remember that this is 2 decades ago where the U.S. is still the engine of growth globally and China was just emerging as the manufacturing hub with its low labor cost. The IMF intervention in July 1997 for Thailand marks the beginning of a serious crisis and we saw growth in the U.S. dropped from 6.2% in the second quarter of 1997 to 5.2% in the third quarter and 3.1% in the fourth quarter of 1997. As a sign of the emergencies of the times, Indonesia had to asked the IMF and World Bank for help in October 1997 after its rupiah dropped by 30% in 2 months (which puts the 1 day 40% CHF decline in perspective after the surprise SNB decision to abandon the EURCHF 1.2 floor on 15 January 2015.) and by January 1998 Indonesians were stockpiling necessities. In May 1998, President Suharto had to resign after 32 years in power due to widespread public discontent with riots on the streets. This was the beginning of serious concerns over a widespread financial crisis engulfing the U.S. and the world. However on hindsight, it was exaggerated as the real impact of the Asian Financial Crisis never really reached the shores of the U.S. in the manner which it affected South Korea, Thailand, Indonesia and Russia. (click to enlarge) Inflation dropped drastically between 1997 and 1998 as the crisis heats up from 3.25% to less than 1.5% within a year. The Fed responded by cutting interest rates by 0.25% on October and November 1998 and by then at the end of 1998, the crisis has largely passed. The Fed went on to reverse its rate cut decision in 1998 by increasing it by 0.25% each in August and November 1999 back to 5%. So the crisis of 1997 shows that the impact can come quickly and it passed quickly. By the time, the worst of the crisis was exaggerated and reported in the market, the crisis has passed and growth had returned. Current Situation The difference between 1997 and the 2007 Credit Crunch that led to the Great Recession of 2008 and 2009 is that they had their source in the housing bubble in the United States. This lead to a longer recovery period but we can see from the chart below that growth has returned in 2010 after the contraction of 2008 and 2009. (click to enlarge) Also the difference between then and now is that after the U.S. recovered in 2010, it is Europe’s turn to get into trouble with their sovereign debt crisis. In contrast, Asia was able to recover relatively quickly after the crisis with a V shape recovery from 1999. This is why the current U.S. recovery took a longer period of time and at such a low rate of economic recovery. However we must acknowledged that enough time has passed and there has been substantial improvement for the U.S. economy. (click to enlarge) We can see in the overlay of GDP growth (listed on the left hand side) and inflation (on the right side). GDP growth has hit 5% in the third quarter of 2014 and this is an 11 year high. On 30 January 2015, we will see the advance estimate for the fourth quarter of 2014 and it is expected to come in strongly at 3.0%. Overall growth for year 2014 should be between 2.5% and 3%. This is a strong economic growth and the U.S. is the only major developed economy to hit this growth rate. The only difference is that the inflation rate has divergence and gone down. There are some pundits that will see this as signs of future economic weakness due to weakening of global demand. This is unlikely to be case as we know that this is due to increase supply of oil from the U.S. due to advances in technology and the unwillingness of OPEC to reduce their output of oil. Benefiting From U.S. Growth The way which investors can benefit from a strong and sustained U.S. growth is to gain exposure to a diversified portfolio of U.S. stocks by the way of the SPDR S&P 500 Trust ETF (NYSEARCA: SPY ). SPY gathers the best companies in the U.S. which are likely to receive the bulk of the increased expenditure when the U.S. recovery gathers steam. Think of company like Apple (NASDAQ: AAPL ) which is the top company in this ETF with 3.54%. AAPL is the company you think of when you want to purchase a new phone or laptop. The next on the list is Exxon Mobil (NYSE: XOM ) with 2.14% of the ETF. XOM has both upstream and downstream activities and its greatest brand for the public is probably the petrol pump of Mobil. While XOM will be pressured during this period of the low energy prices, we can be sure that it is here for the long run and will benefit when smaller competitors are chased out of the market. I could go on but the point is that SPY contains the blue chip companies of the U.S. and you can’t go wrong with it. Its growth might be lesser than if you picked the next Google but you have lesser chance of losing money on a mistake and this is where you should park the bulk of your wealth. SPY is heavily tilted towards technology companies with 17.89% weighting, financial services at 15.25%, healthcare at 14.71%, industrials at 11.18% and consumer cyclical at 10.59% to round up the top 5. Its price is also reasonable at 17 times earnings. (click to enlarge) We can see that after dip of ‘the buy and go away’ month of October, we have seen strong growth in the SPY in November. From December onward to this month, SPY has been in a range of $197 to $210. This represents market worry about the European contagion. As we have seen in the Asian Financial Crisis which the Richmond Fed President has kindly reminded us, this is likely to be overblown in the media. The U.S. recovery has started since 2010 and it has already been 4 years. It has withstood criticism of the quality of the recovery and the tapering of the Fed’s QE which is thought to artificially inflate the equity market. After the Fed formally ended QE3 in October 2014, there was some pullback in the equity market (also due to investor psychology and also bearish articles such as this Forbes article urging readers to stay in Cash.) but it has largely corrected itself. There will always be negative news in the market and we should look beyond them to the bigger picture and trend that has built up over time. The U.S. recovery has been strong and today we had the benefit of looking it through a recent historical perspective. This should guide us in our investment decision framework going forward. A potential catalyst for the SPY would be a good Advance fourth quarter GDP reading exceeding expectations of 3.0% on 30 January 2015. If you are going to take a long position on SPY, it would be advisable to do so before that.