Tag Archives: open-xhr-start

The Case For Maintaining A Strategic Allocation To Real Assets

As investors continue to look for ways to diversify their portfolios away from traditional long-only stock and bond investments, real assets have become a popular alternative asset class. In fact institutional investors, such as leading endowments and foundations, have long used investments in real assets such as real estate, commodities, timber and energy as both a hedge against inflation and as a core diversifier. To provide more insight into this asset class and how institutional investors are using real assets, Michael Underhill, chief investment officer of Capital Innovations and a leading manager of multi-asset real return portfolios, answers a few questions for us on the topic. Given the increase in regional conflicts and greater overall geopolitical risks today, how is this influencing your respective portfolio positioning from both a macro and micro perspective? As geopolitical risks rise we would expect higher volatility in markets, increased risk of supply shocks to key commodities such as oil and food and a discounting of potential higher inflation and subsequent higher interest rates. As a hedge to these types of macro risks, exposure to real assets, and their relative inflation hedge qualities would become more attractive. Positioning on a more micro level we are incorporating these geopolitical risks and have been reducing our relative portfolio weighting in more interest rate sensitive groups such as electric utilities and telecomm and increasing more inflation hedge real assets such as energy, timber, agricultural commodities. What are the risks that investors should think about hedging or mitigating today and why? A common mistake investors make is to extrapolate current environment out too far and become complacent. The current environment of low interest rates, low inflation, and low volatility has afforded the opportunity to hedge the risk that this environment changes over the investment horizon. Do you want to bet that this backdrop we have had since the financial crisis does not change? The ideal time to add real asset exposure is when not many are thinking about it – buy an umbrella when the sun is shining. If we examine an allocation to real assets over the past 24 years, as shown in the chart below, we can see improved portfolio efficiency, with enhanced returns and lower volatility. Historical Effect of Allocating to Commodities (January 1980- July 2014) What are the opportunities investors should be seeking exposure to and why? In 2015, we expect improved global growth and a mid-year increase in US interest rates. The ECB and the BOJ remain in easing mode, and the policy outlook in the rest of the world varies considerably. The risk that global growth remains sluggish is high, and a lack of meaningful improvement could lead to a sharp increase in the dollar and a significant reorientation of capital flows. Most regions should see decreasing growth headwinds in 2015, although geopolitical uncertainties, volatile oil prices, and moderating Chinese growth remain concerns. It is for these reasons that we continue to advocate for a diversified, tactically managed, multi-asset portfolio that seeks to generate returns in excess of the actual rate of inflation and provides managed volatility rather than a single-asset-class solution. A broad range of real asset equity securities, including emerging markets and commodities, real estate investment trusts, and directly held positions in master limited partnerships. How does a global multi-asset real return strategy fit into a liability driven investing framework? The tangible properties of a real asset allow its price to fluctuate with overall market prices of physical assets. Real assets tend to be sensitive to inflation because of their tangible nature. Examples of real assets include direct investment in real estate, commodities, precious metals, timber, energy, farmland, precious metals, commodity-linked stocks, and commodity-linked hedge funds. Most investors are more familiar with investments in financial assets, which are contractual claims that do not generally have physical worth. In an LDI platform, real assets provide potential reductions in surplus volatility to the extent that real asset movements are not highly correlated to movements of financial assets. Returns from real assets may also boost returns since real assets are generally not as efficiently priced as the more competitively priced stocks and bonds. The return potential for real assets has become especially attractive in recent years since stocks and bonds have not performed well. From a risk management perspective, a key benefit from expanding asset classes to include real assets rests on correlations. A group of assets that have high correlations with each other but have low correlations with other groups of assets represent an asset class. There tends to be much less diversification potential from combining assets within an asset class than from combining assets from different asset classes. Real assets represent such a broad asset class that a wide range of correlations exist both within the asset class and with assets from other asset classes, allowing for attractive diversification. Our clients have found that the best performance comes from avoiding the large losses that markets often impose on passive investment portfolios. This tends to be especially important for real assets. As a first step we look behind the market consensus and identify where herding and overreaction phenomena may be at work. These phenomena occur both within and across asset classes. We perform extensive modeling with sensitivity analysis to find our best risk management strategy for an LDI structure. From there we model our best set of segments within an asset class and simulate the surplus volatility and return. This is not just simple quantitative analysis because we must also build in forward looking scenario planning. We track actual LDI performance against expected LDI performance. This type of tracking is revealing in that we can review what we were expecting when the allocations were set and identify where things developed differently. This type of learning over many years of experience is very helpful in building analysis skills.

Will Higher Physical Demand For Silver Drive Up SLV?

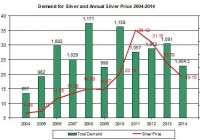
Summary The physical demand for silver has declined in 2014. Even if the demand were to pick up, the price of SLV may keep going down in 2015. The ratio of SLV to GLD gone up in 2014, which means SLV didn’t perform well compared to GLD. This year, the iShares Silver Trust ETF (NYSEARCA: SLV ) didn’t perform well as its price dropped by 18%. The low inflation, the FOMC’s change in policy and the drop in the price of gold contributed to the weakness of silver. Looking forward, even if the physical demand for silver were to pick up, it’s not likely to turn SLV back up. Let’s see why. Physical demand – does it matter? One of the main issues that bullion bulls point out is the changes in the demand for silver that could have an impact on the price of silver and SLV. But I think the changes in the physical demand played a secondary role on the price of SLV in recent years. The chart below presents the changes in demand for silver over the past decade and the average annual price of silver. Source of data Silver Institute and Reuters As you can see, the physical demand for silver seems to have limited impact on the price of SLV in the past few years especially. Back in 2008 the demand for silver reached its highest level in years, and SLV rose over $20, only to fall back by the end of the year to below $9 – so there was a reaction but it didn’t lead to staggering rise in SLV prices. Moreover, the spike in SLV prices during 2011-2012 doesn’t seem to relate to the changes in physical demand for the precious metal. During those years the demand didn’t increase compared to previous years. I also checked the changes in supply during those years — there was no a major shortage for silver on an annual scale more than in previous years. Conversely, even though the demand for silver grew in 2013, the price of SLV came down from its high levels of 2011-2012. Looking forward, HSBC still predicts higher demand for silver in 2015. This is why it retains its forecast price of silver at $17.65 per ounce. China, the world’s largest consumer of silver, will face economic challenges in 2015 – this could suggest China’s demand for silver may not increase any faster than it did in 2014. So the expected rise in physical demand may be harder to achieve next year. The other side of this equation is the changes in supply. In the past decade the supply, which mostly comes from mines, grew at a steady pace. This could change in 2015 as silver producers, which got use to the elevated price of silver over recent years, may taper down their output now that silver prices don’t provide a positive ROI for some of their mines. Such a shift, however, could take time to be reflected silver prices. And in any case, this is likely to be the secondary factor to impact SLV. The main issue is likely to be the changes in the demand for silver on paper, which is mostly driven by silver’s relation to gold, U.S. inflation expectations and treasuries yields. Let’s examine the first two. The issue related to treasuries yield you can see in this past post . This year, SLV has underperformed SPDR Gold Trust (NYSEARCA: GLD ). The relation between the two tended to be very strong and positive for the most part. Source of data: Google finance If GLD continues to remain flat or even slowly comes down, this likely to also bring down the price of SLV. The changes in U.S. inflation also tended to drive higher the price of SLV. The last time the U.S. inflation grew to over 10% was at beginning of the 1980. During that period, the price of silver spiked to around $48 for a very short time before it came back down along with the U.S. inflation. Back then, however, the story behind that spike and crash, which is known as Silver Thursday , was related to the Hunt bothers attempt to corner the silver market. But the rally of silver came even before the Hunt bothers tried to corner the market. Also, gold had a similar rise and fall in the early 80’s. The chart below presents the changes in U.S. core inflation (percent changes from a year back) and price of silver between 1978 and 1998. Source of data: FRED and Bloomberg In the past two decades, however, the U.S. inflation remained relatively flat – below 3%. But silver grew fast in 2011-2012. During those years, although the U.S. inflation remained low, the expectations for a sudden spike in inflation by bullion bulls were high. This is mainly due the FOMC’s policy of implementing its quantitative easing programs in low interest rates environment. Source of data: FRED and Bloomberg In the past few weeks the demand for SLV kept falling down: As of the end of last week, this ETF’s silver holdings have declined by 4% in the last two months. If the demand for silver for investment purposes continues to decrease, this is likely to bring down SLV. The potential fall in supply and expectations for a rise in physical demand may curb down the fall in SLV prices in 2015. But there are other factors that are likely to keep dragging down SLV: As the memories of the Fed’s QE programs remain in the rear view mirror, it becomes harder to see a sudden rise in inflation any time soon. Finally, if gold remains low and inflation doesn’t pick up, SLV isn’t likely to make a comeback in 2015.

Best And Worst Bond ETFs Of 2014

The U.S. stock markets delivered a somewhat muted performance this year (at least when compared to 2013) with the S&P returning about 12% YTD gains. The towering market of last year turned into a market that saw fears about a global slowdown and its effect on U.S. corporate earnings, plummeting oil prices, sluggish growth in Japan, concerns of a triple dip recession in Europe and the outbreak of the Ebola virus that forced many investors to look for safety and shun risky assets. Needless to say, the above threats kept bond yields at the lower side throughout the year causing investors to hunt for income bets. While long-term bond ETFs were weak last year due to taper threats, short-term bond ETFs hit the brakes this year due to rising rate concerns. Despite the Fed’s repeated assertion of keeping the rates low for longer, the recent strength in economic data has led to concerns that the Fed could start raising rates after the first quarter of 2015 instead of the initial June or September 2015 timelines. This in turn has lowered the appeal for short-term bond ETFs giving leeway for long-term bond ETFs to score higher in the face of dwindling global growth and an oil price rout. Flight from risk has caused the yield on the benchmark 10-year Treasury note to hover around 2%. Amid such a situation, it would be interesting to note which ETFs were the leaders and laggards in the bond space during 2014: Winners Two bond ETFs – the PIMCO 25+ Year Zero Coupon U.S. Treasury Index ETF (NYSEARCA: ZROZ ) and the Vanguard Extended Duration Treasury ETF (NYSEARCA: EDV ) – soared this year having returned more-or-less 45%. ZROZ tracks the BofA Merrill Lynch Long U.S. Treasury Principal STRIPS index with effective maturity and effective duration of the fund being 28.99 years. On the other hand, EDV follows the Barclays U.S. Treasury STRIPS 20-30 Year Equal Par Bond Index. The fund has average maturity of 25.3 years and average duration of 25.0 years. The next best performers in the space comes in the form of the iShares 20+ Year Treasury Bond ETF (NYSEARCA: TLT ) , SPDR Barclays Capital Long Term Treasury ETF (NYSEARCA: TLO ) and iPath US Treasury Long Bond Bull Exchange Traded Note (NASDAQ: DLBL ) . These long-term bond ETFs have returned about 25% each this year. SPDR Nuveen Barclays Build America Bond ETF (NYSEARCA: BABS ) – a long-term muni bond ETF too returned smartly (up 21.6%) in 2014. To beat the potential rise in U.S. inflation and rack up gains on the real return, long-term TIPS bond ETF, the 15+ Year U.S. TIPS Index Fund ( LTPZ), was in demand in 2014 and has added about 19.3%. In short, the trend clearly indicates the inclination toward long-term bond ETFs. Beyond the border, PowerShares DB Italian Treasury Bond ETN (NYSEARCA: ITLY ) added about 19% this year thanks to the extremely easy monetary policy. Losers Thanks to the flattening of the yield curve, the U.S. Treasury Steepener ETN (NASDAQ: STPP ) turned out as an acute loser in this space. The product tracks the returns of a notional investment in a weighted “long” position in relation to 2-year Treasury futures contracts and a weighted “short” position in relation to 10-year Treasury futures contracts. Bullish stance on 2-year Treasury made the product a loser. The product was down 18%. Apart from this, junk bond ETFs like Peritus High Yield ETF (NYSEARCA: HYLD ) lost about 13% as returns were great in the safe government bonds space. Needless to say, short-term bond ETFs like the S&P/Citi 1-3 Yr Intl Treasury Bond ETF (NASDAQ: ISHG ) were defeated in the race. The fund is down 10% this year. The fate was similar for the WisdomTree Barclays U.S. Aggregate Bond Negative Duration Fund (NASDAQ: AGND ) with a loss of about 8.5%. Road Ahead Having presented the scorecard of the year, we would like to note that the trend will be quite similar in the year ahead. However, like 2014, TIPS ETFs should be out of the betting list courtesy of a tepid inflationary outlook across the globe. Apart from the long-term government bonds, investors having a stomach for risk can also have a look at the long-term investment grade corporate bond ETFs to earn some regular income along with securing the portfolio. To do so, investors might tap the Long-Term Corporate Bond Index Fund (NASDAQ: VCLT ) , SPDR Barclays Capital Long Term Corporate Bond ETF (NYSEARCA: LWC ) and iShares 10+ Year Credit Bond ETF (NYSEARCA: CLY ) .