Tag Archives: open-xhr-start

Crude Oil Price Prospects As Seen By Market-Makers

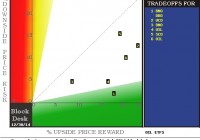
Summary Oil-price ETFs provide a quick look at expectations for change prospects in Crude Oil commodity prices. Market-maker hedging in these ETFs provide an overlay in terms of their impressions of likely big-money client influences on Oil-based ETF prices. But is there a broader story in price expectations for natural gas? And for ETFs in NatGas, following the same line of reasoning? Change is coming, so is Christmas But in what year? Expert oil industry analyst Richard Zeits in his recent article points out how long prior crude oil price recovery cycles have taken, with knowledgeable perspectives as to why. Still, there is also a suggestion that differences could exist in the present situation. Past cruise-ship price experiences of Crude Oil investors on their VLCC-type vessels have marveled at how long it takes to “change course and speed” in an industry so huge, complex, and geographically pervasive. To expect the navigating agility of an America’s Cup racer is wholly unrealistic. Yet some large part of the industry’s present supply-demand imbalance is being laid at the well-pad of new technology and aggressive new players in the game. In an effort to explore the daisy chain of anticipations that may ultimately be reflected by a persistent directional change in the obvious scorecard of COMEX/ICE market quotes, let’s step back a few paces from the supply~demand balance of commercial spot-market commodity transactions to the futures markets on which are based ETF securities whose prospects for price change attract investors in such volume that ETF markets require help from professional market-makers to commit firm capital to temporary at-risk positions that provide the buyer~seller balance permitting those transactions to take place. But that happens only after the market pros protect their risked capital with hedges in the derivative markets of futures and options, which doing so, quite likely provide some much lesser fine-tuning back into the price contemplations back up the ladder that brought us down to this level of minutia. So where to start? Mr. Zeits regularly asserts that his analyses are not investment recommendations, so securities prices are typically unmentioned, and left to the reader’s cogitation. We will start at the other end, where you can be assured that our thinking is in strong agreement with Mr.Z at his end. We convert (by unchanging, logical systemic means, established well over a decade ago) the market-makers [MMs] hedging actions into explicit price ranges that reflect their willingness to buy price protection than to have their perpetual adversaries in (and of) the marketplace take their capital (perhaps more brutally) from them. Using Richard Z’s list of Oil ETFs, here is a current picture of what the MM’s hedging actions now indicate are the upside price changes possible in the next few (3-4) months that could hurt them if their capital was in short positions. The complement to that, price change possibilities to the downside, could be a yin to the upside move’s yang, but we have found better guidance for the long-position investor’s concern in the actual worst-case price drawdowns during subsequent comparable holding periods to the upside prospects. So this map presents the upside gain potentials on the horizontal scale in the green area at the bottom, with the typical actual downside risk exposure experiences on the vertical red risk scale on the left. The intersection of the two locates the numbered ETFs listed in the blue field. (used with permission) Here’s the cast of characters: [1] is United States Brent Oil ETF (NYSEARCA: BNO ) and PowerShares DB Oil ETF (NYSEARCA: DBO ); [2] is ProShares Ultra Bloomberg Crude Oil ETF (NYSEARCA: UCO ); [3] is United States Short Oil ETF (NYSEARCA: DNO ); [4] is United States 12 month Oil ETF (NYSEARCA: USL ); [5] is ProShares Ultra Short Bloomberg Crude Oil ETF (NYSEARCA: SCO ); and [6] is the iPath S&P GSCI Crude Oil Price Index ETN (NYSEARCA: OIL ). Here is how they differ from one another: All are ETFs except for OIL, an ET Note with trivially higher credit risk and possible slight ultimate transaction problems. All except BNO are based on West Texas Intermediate [wti] crude oil availability and product specs, BNO is based on Brent (North Sea oil) quotes, directly influenced by ex-USA supply and demand balances. Most prices are at spot or most immediate futures price quotes, but USL is an average of the nearest-in-time 12 months futures quotes. All are long-posture investments except for SCO and DNO which are of inverse [short] structure. Both UCO and SCO are structured to have ETF movements daily of 2x the long or short equivalent unleveraged ETFs. What is the Reward~Risk map telling us? For conventional long-position investors, items down and to the right in the green area are attractive, to the extent that their 5 to 1 or better tradeoffs of upside potentials to bad experiences (after similar forecasts) are competitive to alternative choices. The closer any subject is to the lower-left home-plate of zero risk, zero return, the less attractive it is to those not traumatized by bunker mentality. SCO, the 2x leveraged short of WTI crude has a +20% upside with a -16% price drawdown average experience with similar forecasts in the past 5 years. It is a slightly better reward than a bet on a long position in Brent Crude and DNO, whose +18% upside is coupled with only -2% drawdowns. SCO’s minor return advantage over DNO comes largely from its leverage which is responsible for its large risk exposure. The same is true for UCO. USL’s trade-off risk advantage over OIL comes largely from smaller volatility in the 12-month average of futures prices that it tracks, rather than only the “front” or near expiration month. Here are the historical details and the current forecasts behind the map. The layout is in the format used daily in our topTen analysis of our 2,000+ ranked population of stocks and ETFs. For further explanation, check blockdesk.com . (click to enlarge) Conclusion In general, this map suggests that we still have ahead of us some further price declines as crude oil equity investors (via ETFs) see advantages in short structures. The spread between WTI crude price and Brent crude may be as narrow now as is likely in the next few months, given BNO’s relative attractiveness here. This analysis will be followed shortly by a parallel on those ETFs focused on Natural Gas and alternative energy fuels.
CWI Has Solid Diversification In Every Way, If Investors Will Pay For It

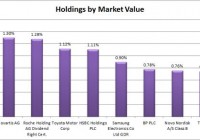
Summary I’m taking a look at CWI as a candidate for inclusion in my ETF portfolio. The expense ratio is high for my taste, but the diversification is great. The correlation to SPY is based on high trade volumes and a long sample period. I’d be cautious about entering at a premium to NAV since I don’t expect those premiums to be maintained indefinitely. I’m not assessing any tax impacts. Investors should check their own situation for tax exposure. Investors should be seeking to improve their risk adjusted returns. I’m a big fan of using ETFs to achieve the risk adjusted returns relative to the portfolios that a normal investor can generate for themselves after trading costs. I’m working on building a new portfolio and I’m going to be analyzing several of the ETFs that I am considering for my personal portfolio. One of the funds that I’m considering is the SPDR MSCI ACWI ex-US ETF (NYSEARCA: CWI ). I’ll be performing a substantial portion of my analysis along the lines of modern portfolio theory, so my goal is to find ways to minimize costs while achieving diversification to reduce my risk level. What does CWI do? CWI attempts to track the total return (before fees and expenses) of the MSCI All Country World Index ex USA. At least 80% of the assets are invested in funds included in this index, or in ADRs representing the assets in the index. CWI falls under the category of “Foreign Large Blend”. Does CWI provide diversification benefits to a portfolio? Each investor may hold a different portfolio, but I use (NYSEARCA: SPY ) as the basis for my analysis. I believe SPY, or another large cap U.S. fund with similar properties, represents the reasonable first step for many investors designing an ETF portfolio. Therefore, I start my diversification analysis by seeing how it works with SPY. I start with an ANOVA table: (click to enlarge) The correlation is moderate at 86.6%. I’d like to see a lower correlation on my international investments, but this is still low enough to provide some diversification benefits. Extremely low levels of correlation are wonderful for establishing a more stable portfolio. I consider anything under 50% to be extremely low. However, for equity securities an extremely low correlation is frequently only found when there are substantial issues with trading volumes that may distort the statistics. Standard deviation of daily returns (dividend adjusted, measured since January 2012) The standard deviation is moderately high. For CWI it is .8916%. For SPY, it is 0.7300% for the same period. SPY usually beats other ETFs in this regard, so this isn’t too absurdly high for another ETF. The combination of the high standard deviation and correlation being at 75% mean I probably won’t consider this ETF for anything more than 5% to 10% of my ETF portfolio. Liquidity looks fine Average trading volume has been high enough that I’m not concerned. The average was around 300,000 shares per day. Mixing it with SPY I also run comparisons on the standard deviation of daily returns for the portfolio assuming that the portfolio is combined with the S&P 500. For research, I assume daily rebalancing because it dramatically simplifies the math. With a 50/50 weighting in a portfolio holding only SPY and CWI, the standard deviation of daily returns across the entire portfolio is 0.7835%. With 80% in SPY and 20% in CWI, the standard deviation of the portfolio would have been .7438%. If an investor wanted to use CWI as a supplement to their portfolio, the standard deviation across the portfolio with 95% in SPY and 5% in CWI would have been .7325%. Why I use standard deviation of daily returns I don’t believe historical returns have predictive power for future returns, but I do believe historical values for standard deviations of returns relative to other ETFs have some predictive power on future risks and correlations. Yield & Taxes The distribution yield is 3.12%. The SEC yield is 2.22%. That appears to be a respectable yield. This ETF could be worth considering for retiring investors. I like to see strong yields for retiring portfolios because I don’t want to touch the principal. By investing in ETFs I’m removing some of the human emotions, such as panic. Higher yields imply lower growth rates (without reinvestment) over the long term, but that is an acceptable trade off in my opinion. I’m not a CPA or CFP, so I’m not assessing any tax impacts. Expense Ratio The ETF is posting .34% for an expense ratio. I want diversification, I want stability, and I don’t want to pay for them. The expense ratio on this fund is higher than I want to pay for equity securities, but not high enough to make me eliminate it from consideration. It is pushing that way though. I view expense ratios as a very important part of the long term return picture. Market to NAV The ETF is at a 1.09% premium to NAV currently. Premiums or discounts to NAV can change very quickly so investors should check prior to putting in an order. I wouldn’t want to pay this premium unless I could find a solid accounting justification for it. The ETF is large enough and liquid enough that I would expect the ETF to stay fairly close to NAV. Generally, I don’t trust deviations from NAV and I will have a strong resistance to paying a premium to NAV to enter into a position. Largest Holdings The diversification is fairly solid in this ETF. My favorite thing about the ETF is easily the diversification. If I’m going to be stuck with that expense ratio, I expect it to buy a fairly strong level of diversification and in this case it appears to do just that. (click to enlarge) Conclusion I’m currently screening a large volume of ETFs for my own portfolio. The portfolio I’m building is through Schwab, so I’m able to trade CWI with no commissions. I have a strong preference for researching ETFs that are free to trade in my account, so most of my research will be on ETFs that fall under the “ETF OneSource” program. I like the correlation and the diversification in the holdings, but the expense ratio is a bit high and I wouldn’t want to enter into a position at a significant premium to NAV. In my opinion, 1% is a fairly significant premium to pay with no assurance that I could exit the position at the same premium. This looks like an ETF to keep on my list as an option for international exposure. If selected, I would wait for an entry price with a much smaller (or non-existent) premium to NAV.

How Do You Find Value Investment Ideas?

It’s easy to drown while trying to drink from the fire hose of information that is the stock market. After 25+ years of value investing successes and failures, I’ve come up with my 11 favorite shortcuts to finding promising companies. Did I miss any shortcuts? How do you find value investment ideas? I’ve got the fire roaring, eggnog in hand, enjoying some downtime during the hectic holiday season. The New Year is approaching, which inevitably has me looking back over the investment year that was. There were some successes and, as always, there were some failures. I still flinch while thinking about my ill-timed “deworsification” into the Russian stock market. One question I always try to answer is, “How exactly did I find my best ideas?” Value investing is for investors with a long-term outlook and simply looking back over the last year is not going to be very informative. The sample size is too small and not enough time has elapsed to let investment themes play out. So instead of just looking at the past year, I decided to go back a little further. During my investment career, I have spent a substantial amount of time searching for excellent value ideas. But finding that one gem in the ocean of possible alternatives can be overwhelming. It’s easy to drown while trying to drink from the fire hose of information that is the stock market. So over time, I have unearthed many useful tools that have helped me to discover great ideas. Some of these shortcuts started off extremely useful and continue to be powerful, but some simply didn’t pan out or lost their efficacy. I went back over the last 25+ years of my investing career and tried to recall how I first stumbled across each successful investment idea. I then narrowed this list down to the top 11 ways to find new ideas that I have found most useful. The list progresses from least to most valuable. Traditional Media – I wasn’t sure if I should include media on this list as it can really be more of the delivery mechanism for the other criteria below, but I have been spurred to look closely at a company because of information I’ve gathered through various media outlets, including newspapers, television and business websites. I tend to find investable concepts more than individual stock picks using traditional media, and there is a ton of noise, but there’s a lot of good information out there if you look hard enough. Removal From an Index – Obviously, when a stock is dropped from an index, there is forced selling by index funds that hold the name. However, the index sponsors also try to game the system. Companies that are added to an index tend to be sexy and on an upward trajectory, while companies that are dropped from an index tend to be stodgy and are often out of favor. The oversold cast-offs can be an attractive place to discover value investments. New CEOs – This really depends on the specific situation. If a company’s CEO is retiring after being named Time Magazine’s “Person of the Year”, when the company’s stock price is at an all-time high, it’s not going to attract my attention. If a CEO is pushed out by the board after failing miserably, now we’re talking! A new CEO can make a huge difference in the right situation. Companies that tend to benefit the most from a change at the top tend to have a smaller market cap, a manageable debt load and strong free cash flow. Biggest Percentage Losers – I check the biggest losers list every day. Most of these stocks deserve the sell-off, but every so often a great idea can be salvaged from this discard pile. When bad news comes out, many investors sell first and ask questions later, if ever. I’ve worked as an equity analyst and I have seen this first hand. The thought of going into a client meeting with a dog that dropped 40% makes investment professionals cringe. Stocks that drop dramatically often sail right past true value. 52 Week Lows – This is another list that I check every day. What’s on the list? Why? It’s a fantastic way to spot industry trends as well as to find individual companies that have been left for dead. It’s a fantastic list to use to find bargains, but just because a stock is at a 52-week low, it doesn’t mean it’s undervalued. Exiting Bankruptcy – Companies that are overlooked with a checkered past can often lead to very attractive gains. Bondholders often receive equity when a company emerges from bankruptcy and many times they sell it quickly, depressing the company’s share price. Organizations that are exiting bankruptcy often have smaller debt loads and have shed unattractive businesses during their reorganization, yet are still covered in the taint of failure. If you feel your nose wrinkling as your face contorts into a look of disgust upon hearing the name of a company that imploded into bankruptcy, but is now emerging, you may be on to a great investment idea. Insider Buying – A sizeable open market purchase by an individual with intimate knowledge of a business can be a fantastic buy signal. However, there can be a lot of noise. Ignore small, insignificant purchases and stock acquired through options. Pay more attention to open-market purchases by company management with a good track record of buying and selling stock, especially when there is size to their trades. Gurus – Do you have a team of 20 well-paid, remarkably intelligent and highly-trained analysts at your disposal? No? Neither do I, but many successful value managers have this and much more. So why not utilize their resources? I don’t tend to get too excited when I see that 40 hedge fund managers own Apple, but when a highly-respected value manager purchases 5% of a $100 million company, then I tend to take notice. Always pay attention to the type of manager you follow as some trade frequently and utilizing their public filings is not advisable. However, there is an extended list of value managers with long-term time horizons and superior track records that trade infrequently. Untraditional Media – I would include blogs and newsletters in this category, including Seeking Alpha. Ideas from untraditional media can be hit or miss, but I’ve cultivated a small group of analysts/investors that I genuinely trust and rely on. Unlike many of the other resources I use to find investment ideas, I can assume that the ideas presented by this trusted group will be well-thought-out and worth a second look. I’m always searching for smart investors that share the same value investing methodology as myself. Sentiment – As a value investor, I want to see high negative sentiment. The more hated and despised a company is, then the more interested I become. When everyone is negative, the slightest positive news can start to move a stock upward. I have always viewed traditional academic value screens as a measure of sentiment. The reason most companies are trading in the bottom decile of book value is that they are hated. Some of my favorite valuation screens include price/book, price/sales and EV/EBITDA. If these metrics are depressed, you likely have a company with very poor sentiment. Spin-offs – I know. I’m sure many of you are cringing, wondering why you should sit through another narrative on why spin-offs are so great. I agree…but they still work. I won’t go through all of the reasons that spin-offs tend to outperform as the information is freely available across the internet. If the information is so freely available, shouldn’t the strategy stop working? Yes, it should. But when going back through my investing career, I have used the strategy to consistently find huge winners. I imagine that spin-offs will lose their ability to outperform eventually, but I don’t believe we are at that point just yet. Index funds still dump spin-offs that are not in their index and individuals still dump the 25 share position that has magically appeared on their brokerage statement. Although investors need to be more selective when investing in spin-offs today, especially when many savvy investors are familiar with the strategy, there are still excellent opportunities available. Hopefully I’ve been able to outline a strategy or two that readers will find helpful. Undoubtedly, there are many more strategies that successful investors use to uncover great value ideas that I have missed. I’d love to hear from the Seeking Alpha community. How do you find value investment ideas?