Tag Archives: open-xhr-start

Dividend Growth Stock Overview: UGI Corporation

About UGI Corporation UGI Corporation (NYSE: UGI ) is a holding company that through its subsidiaries distributes, stores, transports and markets energy products to customers across the United States and Europe. UGI distributes liquefied petroleum gases (LPGs), provides natural gas and electric service, and generates electricity to retail customers. The company is also a regional marketer of energy commodities, and HVAC, refrigeration and electrical contracting services. UGI has several subsidiaries through which they do business. UGI’s domestic propane business is primarily conducted through AmeriGas Partners (NYSE: APU ), which supplies LPGs to over 2 million customers across all 50 states. UGI Utilities serves about 600,000 natural gas utility customers in eastern and central Pennsylvania and western Maryland. In fiscal year 2014, UGI Utilities sold or transported over 192 billion cubit feet of natural has through its gas main distribution system. UGI Energy Services markets and distributes natural gas, electricity and liquid fuels to about 19,000 customers in the mid-Atlantic region of the United States. UGI serves the international market through UGI International, which serves the European market through three subsidiaries: Antargaz, Flaga, and AvantiGas. Antargaz serves France and the Benelux countries; the company sold over 300 million gallons of LPG through retail outlets to customers in these markets. Antargaz has over 230 thousand customers across these countries. Flaga ditributes LPGs throughout the Eastern European and Nordic markets and sold over 230 million gallons of LPGs to 70 thousand customers. AvantiGas serves the United Kingdom LPG market and sold over 145 million gallons of LPGs in fiscal year 2014. Each of these subsidiaries is either the leading or one of the leading LPG distributors in their respective markets. UGI also has a small LPG distribution business in China through a majority-owned partnership. UGI has stated that it is committed to delivering 6 to 10% EPS growth and 4% annual dividend growth. For UGI’s 2014 fiscal year (which ended Sept. 30, 2014), revenues were $8.28 billion and operating income was $1.01 billion, up 15.0% and 21.0% from FY2013, respectively. Earnings per common share were $1.92 in FY2014, up 20.0% from FY2013. UGI is also meeting its dividend growth objectives; see below for more details. The company is a member of the S&P Mid Cap 400 index and S&P’s High Yield Dividend Aristocrats index, and trades under the ticker symbol UGI. UGI Corporation’s Dividend and Stock Split History (click to enlarge) UGI has increased dividends at an average annual rate of over 9% for the last five years. UGI has paid dividends since 1885 and increased its dividends since 1988. UGI pays dividends on the first day of January, April, July and October. The company traditionally increases its dividend in the second quarter of the calendar year, announcing the increased dividend at the end of April and with the stock going ex-dividend in mid-June. In 2014, UGI announced two dividend increases; the first, a 4.5% increase, came in the second quarter and the second, a 10.6% increase, came in the third quarter. UGI paid a total of 74.5 cents per share in 2013 and 82 cents in 2014 – a net increase of 10.07%. I expect UGI to announce their next increase at the end of April 2015. UGI’s dividend growth year-to-year has fluctuated greatly. Between 1992 and 2002, UGI increased its dividend very slowly, with annual growth in the low-to-middle single digit percentages. Offsetting this were large dividend increases from 1987-1991 and 2003-2006. The net result is that as you over greater periods of time, the compounded dividend growth rates decrease. UGI’s 5-year compounded annual dividend growth rate (CADGR) is 9.19%, its 10-year CADGR is 7.24%, its 20-year CADGR of 5.08%, and its 25-year CADGR is 4.92%. UGI has split its stock 5 times since 1987. The most recent stock split was a 3-for-2 split in August 2014. Prior to that, UGI split its stock 2-for-1 in September 1987, May 1990 and May 2005, and 3-for-2 in February 2003. For each share of stock you owned in 1987, you would now have 18 shares of UGI stock. Over the 5 years ending on December 31, 2014, UGI stock appreciated at an annualized rate of 22.50%, from a split-adjusted $13.77 to $37.98. This significantly outperformed both the 13.0% annualized return of the S&P 500 and the 14.9% annualized return of the S&P Mid Cap 400 index during this time. UGI’s Direct Purchase and Dividend Reinvestment Plans UGI has both direct purchase and dividend reinvestment plans. The plans are very favorable to investors, as UGI covers all the fees when you buy shares, whether through direct purchase or dividend reinvestment. If you’re a new investor, the minimum initial purchase is $1000. For additional direct purchases, the minimum is $25 for purchases by either check or automatic debit. When you sell your stock, you’ll pay a sales fee of either $15 or $25 (depending on the type of sell order) plus a processing fee of 12 cents per share. Helpful Links UGI Corporation’s Investor Relations Website Current quote and financial summary for UGI Corporation (finviz.com) Information on the direct purchase and dividend reinvestment plans for UGI Disclosure: I do not currently have, nor do I plan to take positions in UGI.

The Income Buyer’s Guide To MLP ETFs

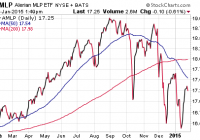
Master limited partnerships, or MLPs, are a unique corner of the energy sector that produce high yields without the strict ties to interest rates. I like to classify MLPs as an alternative income asset class because of these unique properties. There are currently a total of 25 MLP ETFs and ETNs trading on U.S.-listed exchanges. Master limited partnerships, or MLPs, are a unique corner of the energy sector that produce high yields without the strict ties to interest rates. These dividend-generating machines are allowed to pass a majority of their profits to shareholders through distributions, which make them attractive for income seekers. In addition, they don’t follow the same price patterns as traditional stocks and bonds, which is a bonus for those looking to diversify or balance a broad mix of assets. I like to classify MLPs as an alternative income asset class because of these unique properties. MLPs don’t operate like a traditional energy company. Rather, they offer a toll road-style business that operates pipelines, storage facilities, and other infrastructure needs for oil and natural gas commodities. This makes their business models less susceptible to the whims of the commodity markets, and offers a steadier stream of reoccurring revenue. Many investors like to own MLPs directly within a taxable account because there can be some tax benefits available for sophisticated shareholders. Each direct investor in an MLP is considered a limited partner, and thus, is sent a K-1 at the end of the year according to their proportionate share of the financial outcome. However, there are also a number of ways to own these securities through a diversified and liquid investment vehicle that offer their own benefits and risks. There are currently a total of 25 MLP ETFs and ETNs trading on U.S.-listed exchanges. While many of these funds show similar characteristics, there are often very unique index construction techniques that set them apart from each other. The largest fund in this space is the ALPS Alerian MLP ETF (NYSEARCA: AMLP ), which has over $9 billion in total assets. AMLP tracks the 25 largest MLPs by market cap, and has a current 30-day SEC yield of 7.04% as of the end of 2014. Its top holdings include: Enterprise Products Partners LP (NYSE: EPD ), Magellan Midstream Partners LP (NYSE: MMP ), and Plains All American Pipeline LP (NYSE: PAA ). As you can see on the chart above, AMLP has been guilty by association with regards to the deflation in energy prices over the last six months. This ETF has seen a marked increase in volume and volatility as a result of the downgraded expectations for energy-related companies. However, on a relative basis, this MLP index has held up far better than traditional oil producer stocks. One of the differentiating factors in owning AMLP versus a direct investment in a master limited partnership is that you will not receive a K-1 at tax time, which can be a headache to deal with. Instead, all distributions will be reported on a 1099 like most conventional ETFs. It also means that AMLP incurs a hefty expense ratio – about 8.5%, according to some calculations – most of which is to cover tax liabilities. If you are looking for a more diversified MLP ETF with defensive properties, you may want to consider the First Trust North American Energy Infrastructure ETF (NYSEARCA: EMLP ). This actively managed ETF selects both MLP and traditional utility companies operating in the U.S. and Canada. EMLP has a wider base of 66 holdings and total assets worth over $1 billion. The benefit to this unique strategy is the broader diversification into the utility space, which is often a stalwart sector during periods of stock market volatility. However, the trade-off is that EMLP has a watered down 30-day SEC yield of 2.76% compared to the much higher income from AMLP. If a high income stream is a priority, the Yorkville High Income MLP ETF (NYSEARCA: YMLP ) should be on your radar. This ETF follows the Solactive High Income MLP Index, which selects holdings according to rules-based criteria for the current distribution rate and historical growth of the distribution. YMLP has a current 30-day SEC yield of 11.59%. The fund has 25 holdings that vary significantly in structure and asset allocation from the industry benchmark. This ETF may be an opportunity to supplement AMLP as a tactical holding for broader coverage of the MLP space or used to enhance the overall yield of an income portfolio. If cost of ownership is a core tenet of your screening criteria, the Global X MLP ETF (NYSEARCA: MLPA ) and Global X MLP & Energy Infrastructure ETF (NYSEARCA: MLPX ) are worth consideration. Both funds have one of the lowest expense ratios in this sector, with management fees of just 0.45%. MLPA follows a more traditional asset allocation to the industry benchmark with 35 holdings, while MLPX has exposure to 41 securities that are geared more towards energy infrastructure corporations. No matter what index you ultimately choose, these ETF options can help strengthen your dividend stream and enhance the capital appreciation potential of a balanced income portfolio . With many of these funds currently well off their highs, the opportunity for new capital to be incrementally added is worth consideration. However, because of the heightened volatility, I recommend that you pair new positions with a stop loss or sell discipline to manage downside risk . Additional disclosure: David Fabian, FMD Capital Management, and/or clients may hold positions in the ETFs and mutual funds mentioned above. The commentary does not constitute individualized investment advice. The opinions offered herein are not personalized recommendations to buy, sell, or hold securities.

Inside The New Target Factor ETFs From iShares

Deflationary fear and a slowdown have started to trouble developed international markets, and most investors in the ETF world are looking out for quality exposure in the area. In fact, some aggressive investors are hunting for high momentum stocks presuming that these might outperform in the days ahead in the prevailing easy money era. Their search looks justified. After all, the Fed withdrew its gigantic QE program last year and might start walking the way of policy tightening later this year. Thanks to such policy differential in the developed world, iShares – the largest ETF issuer in the world – brought about two products targeting the developed international economies probably to quench investors’ thirst. We have detailed the two newly launched funds below. iShares MSCI International Developed Momentum Factor ETF ( IMTM) : For a broad foreign market play with a focus on large-and-mid cap companies, investors could consider IMTM which focuses on 12 developed countries for exposure. Stocks that exhibit a higher price momentum will be included in the fund. This product follows the MSCI World ex USA Momentum Index, holding 269 securities in its basket and charging a pretty low fee of 30 basis points a year for this relatively unique exposure. Though the fund holds about 28% exposure in the defensive health care sector, it is more inclined toward higher beta sectors like financials, industrials companies and consumer discretionary. Top nations include Japan (29.6%), Canada (18.0%), and Switzerland (12.9%) while the U.K. (8.8%) and Germany (4.7%) round out the top five for this well-diversified fund. The fund does not have much company concentration risk with no stock accounting for more than 5.34% of the fund. Novartis (NYSE: NVS ), Roche and Bayer ( OTCPK:BAYRY ) are the top-three holdings of the fund. IMTM Competition: Momentum strategy is not yet popular in the ETF world. Though the domestic economy has a couple of ETFs including the $1.46 billion-First Trust Dorsey Wright Focus 5 ETF (NASDAQ: FV ), $1.61 billion-PowerShares DWA Momentum Portfolio (NYSEARCA: PDP ) and $515 million-iShares MSCI USA Momentum Factor ETF (NYSEARCA: MTUM ), the international arena is relatively less penetrated. Global Momentum ETF (NYSEARCA: GMOM ) made an entry late last year in the international space and has amassed about $26 million in assets so far. Given GMOM’s high expense ratio of 94 bps and iShares’ own product MTUM’s considerable success in a short span, we expect the issuer to replicate the success on its global version as well. However, the issuer should take note of Cambria’s active approach to the momentum theme which might give it an edge over IMTM in volatile markets. iShares MSCI International Developed Quality Factor ETF ( IQLT) : This fund gives investors exposure to quality stocks (excluding U.S.) by identifying companies that have the highest quality scores based on three main fundamental variables – high return on equity, stable earnings year-over-year growth and low financial leverage. The product charges investors 30 basis points a year in fees and tracks the MSCI World ex USA Sector Neutral Quality Index. The fund holds about 289 securities in its basket with a focus on financials (26.9%). Industrials (12.1%), Consumer Discretionary (11.5%), Health Care (10.8%) and Consumer Staples (10.6%) occupy the next four spots. The fund is heavy on the U.K. with about one-fourth of the exposure followed by Switzerland (15.6%). Roche takes the top-most allocation in the portfolio with about 5.2% exposure followed by Novo Nordisk (2.7%) and Nestle (2.31%). IQLT Competition: There are currently a few products operating in the space including PowerShares S&P International Developed High Quality Portfolio (NYSEARCA: IDHQ ), SPDR MSCI World Quality Mix ETF (NYSEARCA: QWLD ) and Market Vectors MSCI International Quality ETF (NYSEARCA: QXUS ). While neither has developed a huge following so far and IDHQ charges a bit high at 55 bps, IQLT has scope for outperformance.