Tag Archives: open-xhr-start

So Exactly What Is Insider Trading? When Is It Unlawful? Lawful Or Unlawful, What Does It Cost You As An Investor?

A recent federal appeals court decision has consequences for investors in publicly-traded securities. The decision raises the bar for the successful prosecution of insider traders who are “remote tippees.” The decision is likely to imposes additional, mostly unquantifiable costs on many investors. Costs associated with investing in publicly-traded securities aren’t always apparent. Examples of non-apparent investment costs include (1) the expenses of your trades being “front-run” via flash orders, (2) collusive bid-ask spreads, (3) excessive executive compensation, and of course (4) seemingly small intermediary fees that in fact are unreasonably large. These costs add up. And they reduce investment returns, sometimes significantly. Another investment cost is the amount by which through an imbalance in available investment-related information between parties to a securities trade an investor pays more than he or she should to buy securities. Or receives less than he or she should to sell securities. The key word in the foregoing sentence is “should.” “Should” in this context encompasses a notion of fairness. What information should an investor expect to be available relative to the information available to the person or institution on the other side of the trade? What is fair? Recently, the influential United States Court of Appeals for the Second Circuit, in the case of United States v. Newman and Chiasson , overturned insider trading convictions of two Wall Streeters who received tips of material non-public information – third- and fourth-hand – about stocks. The Wall Streeters then traded on that information and profited. Substantially. The Second Circuit overturned the convictions because the government did not demonstrate two elements that the Second Circuit stated must exist to convict a person for unlawful insider trading: one, that the original source of the material non-public information received a personal benefit in exchange for providing illicit tips and, two, that the individuals who traded profitably knew of that personal benefit. The Second Circuit cited the United States Supreme Court case of Dirks v. SEC , 463 U.S. 646 (1983) as precedent for the required demonstration of these two elements. Despite the Second Circuit’s view that its decision only follows existing law, an upshot of the decision is that trading in American public securities markets on the basis of material non-public information will increase. There are too many gray areas in securities trading fact patterns for an increase to not result. So, if you and I as investors trade without access to that information, then with correspondingly increasing probability the person or institution on the other side of our trade will be “informationally-advantaged.” That advantage is another investment cost to you and me. How should an investor in publicly-traded securities respond to United States v. Newman and Chiasson ? As a practical matter not much can be done. (All increases in non-apparent investment costs, quantifiable or unquantifiable, further erode confidence in our public securities markets. Eroded confidence decreases the liquidity and vitality of those markets. That’s a subject for another day however.) From an optimist’s perspective here’s a suggestion, which isn’t new and just reinforces existing good investment practices: minimize the informational disadvantage – and resulting costs – by trading as infrequently as practical. Trade only to rebalance or put excess cash to work for the long term. When trading in funds such as ETFs, trade very infrequently – again, only to rebalance or put new cash to work – and try to identify funds with low internal turnover. Now that you’ve read this, are you Bullish or Bearish on ? Bullish Bearish Sentiment on ( ) Thanks for sharing your thoughts. Why are you ? Submit & View Results Skip to results » Share this article with a colleague
Low Risk And Long-Term Success Portfolio Update 2015

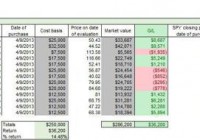
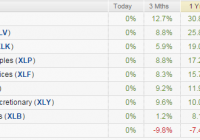
2015 will be a year of minimal returns for broad S&P 500 funds, but will be a good year for international funds and gold. High yielding investments in vehicles such as REITs could see lots of volatility due to interest rate risks. Investors should consider taking some profit off of U.S. equities and diversifying internationally to take advantage of lower valuations and room for P/E expansion. The last few years have been fantastic for exchange-traded funds (ETFs), according to data accessed by ETF.com. In fact, U.S. stock ETFs have surpassed last year’s inflow records, and for the first time ever, U.S. ETFs have surpassed $2 trillion. A popular S&P 500 ETF, the SPDR S&P 500 Trust ETF (NYSEARCA: SPY ), has seen the heaviest inflows at nearly $25 billion in 2014. In contrast, emerging market ETFs (NYSEARCA: EEM ) and gold ETFs (NYSEARCA: GLD ) have seen outflows. This marks a perfect opportunity for a trite quote from Warren Buffet, “Be fearful when others are greedy and greedy when others are fearful.” My theory is that many investors have missed out on the upswing of the market and are now “performance chasing” because they feel left out. I am taking the contrarian position and urging to shift some money out of direct investments in the U.S. equity market, and consider larger allocations to international markets, and even emerging market exposure. The original portfolio I created on April 9, 2013, can be accessed here . My portfolio has underperformed the S&P 500 by a significant extent; however, the portfolio I created also contained 18% allocation to bonds, 17% international exposure, emerging markets, and gold. This diversification has led to lackluster performance as the S&P has surged. Keep in mind this is not a portfolio built for everyone. Based on your tolerance for risk and your investment objectives, the amount of money you allocate to certain asset classes must make sense for your goals. In my asset allocation methodology for this year and beyond, I am making some key assumptions that are worth noting. Firstly, I believe the market is fairly valued to slightly overvalued based on historical price-to-earnings ratios. Due to the low interest rate environment, low inflation rate, and the quantitative easing actions of the Federal Reserve, I believe that inflated price-to-earnings ratios makes sense. With that being said, I feel that rates will increase to some extent in this year and that investors seeking high yield investments should be wary. Instead of riding out the high yield environment, my first action will be to remove the allocation to the Vanguard REIT Index ETF (NYSEARCA: VNQ ), and keep my position in the Vanguard High Dividend Yield ETF (NYSEARCA: VYM ). The reason that I am not recommending a reduction in VYM is because of the amount of high quality value stocks found in this fund. What I am certain many people hear all too often are obscure references to the stock market stating it is too high or too low. What I rarely hear are defined examples of why they believe the market is high or low, or by what measuring stick they are referencing. I tend to favor the simplistic. A quick answer to the “Why?” that many investors ask is an indicator of market valuation by economist and well-known author of Irrational Exuberance – Robert Shiller. The Shiller price-to-earnings ratio is calculated using the annual earnings of the S&P 500 over the past 10 years. The past earnings are adjusted for inflation using CPI, bringing them to today’s dollars. The regular price-to-earnings ratio is just shy of 20, which is right at the historical average. (click to enlarge) Based on this information, I believe the market is fully valued. Most agree with the contention that the price-to-earnings ratio of the S&P isn’t trading at a huge bargain. The actions of the Federal Reserve may push the S&P to further valuations above historical averages. My personal view is that while you cannot time the market, you also should avoid pouring into the market when it appears fully valued as many appear to be doing. In fact, at this point I would be doing the opposite of the crowd. Emerging markets and precious metals offer value, and I believe smart money is moving into these asset classes. Using the proceeds from my sale of VNQ, I would purchase the Schwab International Equity ETF (NYSEARCA: SCHF ). This is an international large blend style ETF, sector weighted in financials at an expense ratio of only .08% that will reward patient investors in the long run. I also like that their top holding is Nestle SA ( OTCPK:NSRGY ). The regional breakout provided by Morningstar is roughly 18% exposure to the United Kingdom, 37% exposure to Europe developed, 20% exposure to Japan, 7% Australia, 8% Asia developed, and 8% to the U.S. Gold and the U.S. dollar are inversely related, as you can see from the chart from Macrotrends . While I do not believe gold will experience incredible growth and I cannot promise grandeur, I do believe gold should be a part of your portfolio. I will trust my judgement to raise my portfolio bet in gold to 4% from 3% in my theoretical portfolio. (click to enlarge) Oil seems to be a hot topic today so I wouldn’t want to ignore it in my portfolio construction. While I cannot predict the future – I tend to bet that things “return to normalcy” over the long haul. Thus, my view is that oil will return to a pricing level around $75-$85. In the passive investing space, I am not making an actionable bet on the price action of oil. However, I do believe an opportunity exists for active investors who are diligent about researching quality businesses that are now discounted due to the fall in oil prices. One example I found was Schlumberger Limited (NYSE: SLB ). In another article , I discuss the benefits of individual selection in the oil and gas space. (click to enlarge) In my original portfolio, I made favorable S&P sector bets in the Utilities (NYSEARCA: XLU ) and Health Care (NYSEARCA: XLV ) sector ETFs. In the sector rotation model, it is clear that these two outperformed in the last year, signaling a potential business cycle decline. I do not live or die by sector rotation investing strategies; however, I do not think they should be ignored completely. I tend to look at the relative valuation of companies by sector and make my own judgments as to whether or not they are fairly valued. Interestingly, the financial sector does seem to be an unloved sector which could provide excess returns. Bill Nygren, a fund manager that I follow from Oakmark, is also overweight financials. With a belief that interest rates will rise, supporting sector rotation modeling, and the support of a successful value investing manager, I can remove the clouds and make a clear decision to shift my sector bet from Utilities to Financials (NYSEARCA: XLF ). I am holding onto Health Care because the long-term outlook remains positive. A close third would be the Technology sector (NYSEARCA: XLK ). In summary, I would sell my position in the high yield REIT ETF and use the sources to purchase SCHF to gain more international exposure. I would sell the Utilities sector ETF and purchase the Financials sector ETF with the proceeds. I would also sell a portion of my position in the Vanguard Short-Term Bond ETF (NYSEARCA: BSV ) and purchase additional amounts of the gold ETF until I reach the 4% of total portfolio allocation mark. Given the facts of today, I can only make what I feel is the best decision possible given a certain risk tolerance and investment objective. I hope you find this article useful as you too adjust your portfolio to the current market conditions. As always, best of luck in the new year!

Buy Energy CEFs With Large Distributions And Steep Discounts To Play An Oil Rebound

Summary Energy was the worst performing sector in 2014. Year end tax loss harvesting driven both energy stocks and CEFs lower setting up a potential for a strong rebound. Funds are available with distributions as high as 12.16% and discounts as wide as 14.85%. Overview: After a strong start to 2014, energy stocks slid in the second half driving energy to be the worst performing sector of the year. Source: Seeking Alpha 1/1/2015 Oil prices have suffered due to the stronger dollar and OPEC’s decision not to cut oil production. The iPath S&P GSCI Crude Oil ETN (NYSEARCA: OIL ), which follows the price of west Texas intermediate crude oil, fell 51% from a high of $25.96 on June 20, 2014 to close the year at $12.54. This large fall in oil prices put significant pressure on energy stocks. There is much debate about what energy prices will do in 2015. Geopolitical risk doesn’t seem to be decreasing and could drive large spikes in oil prices if issues in the Middle East or Russia flare up during the year. On the other side, U.S. energy companies are only now starting to cut capital budgets. U.S. production levels are still expected to be higher in 2015 than in 2014. U.S. production growth combined with stable output from OPEC nations could continue to pressure oil prices. Another variable will be global economic growth. The United States has seen economic growth strengthen, while Europe continues and China’s growth rate has continued to slow. If the global economy is able to strengthen in 2015 it would support oil prices. Energy stock’s move lower has improved the energy sector’s attractiveness relative to the S&P 500. Using the Energy Select Sector SPDR (NYSEARCA: XLE ) to represent energy stocks, we see that energy offers a higher dividend yield with lower price to earnings and price to book ratios than the SPDR S&P 500 Trust ETF (NYSEARCA: SPY ). However, forward growth expectations for the energy sector are lower than the S&P 500. 5 year forward growth expectations for energy have fallen from 12.73% in September to 10.21% now as analysts have cut their expectations due to lower oil prices. Source: State Street Global Advisors 1/1/2015 The move lower in energy stocks also impacted closed end funds investing in energy. The funds offer attractive yields and continue to trade at wide discounts to underlying net asset values. Investors looking to add to energy holdings in 2015 would be wise to look at CEFs as a way to buy $1.00 of assets for $.90 or less. Investors could also see an added boost as year end tax loss harvesting has affected both the closed end funds and the underlying securities. This could set up an interesting rebound if oil can stabilize. Closed end funds also offer attractive distributions. Some of the funds use options strategies to decrease risk increase distributions. Energy stocks remain attractive long term and offer one of the better values in a stock market hitting all time highs. Energy is also an attractive investment as most investors are naturally hedged. Energy is used to fuel their car or heat their homes. If energy prices fall, energy consumption costs will move lower, helping to offset losses in their investment portfolio. If energy prices rise, investors should see better performance in their investment portfolio to help cushion the increased cost at the pump. Gasoline prices have fallen along with oil and now could be an attractive point to increase this hedge in investors portfolios. The graphic below lists several metrics that can help quickly evaluate closed-end funds including distribution, leverage, premium/discount, 1 Year Z-Statistic (from Morningstar), historic returns, and fund expense ratios. Data for XLE and the iShares Global Energy ETF (NYSEARCA: IXC ) are also included to provide ETF options for investing in the same space. Data for the SPY is included to offer information for the broader market. The ETF results can also be used as a benchmark to evaluate performance. (click to enlarge) Source: Morningstar 1/1/2015 All of the energy CEFs showed negative performance for the last three months. There was a wide range of performance from the Voya Natural Resources Equity Income Fund (NYSE: IRR ) posting the best return of -14.18% to Tortoise Energy Independence (NYSE: NDP ) posting a -21.58% NAV return. CEF discounts have remained pretty close to their levels at the end of Q3. The most notable exception was BlackRock Energy & Resources (NYSE: BGR ) which saw its discount narrow to 5.67% from 10.75%. The relatively poor performance from BGR in 2014 is a little surprising. The fund is unlevered and uses an options strategy to produce extra income and reduce risk. BGR has a strong management team that has produced relatively attractive returns over longer periods particularly compared to IXC. IXC is probably the more appropriate benchmark due to the fund’s large exposure to international integrated oil names. BGR’s discount narrowed in the fourth quarter. The narrow current discount reduces the attractiveness of BGR at current prices compared to some of the other CEFs. An in depth profile of BGR is available here . The Cushing Renaissance Fund (NYSE: SZC ) had the strongest performance of energy CEFs during 2014. However, SZC had a difficult fourth quarter. The fund takes a little different approach to energy investing. SZC is focused on companies poised to benefit from increased domestic oil production. The fund invests in both the energy companies working to boost their production, as well as industrial companies that are expected to benefit from lower energy and feedstock costs. This is a broader way to invest in companies poised to benefit from the North American shale revolution. The fund saw a significant slide in the fourth quarter as lower global energy prices reduced the competitive advantage of lower US energy prices. SZC’s price is likely to show the largest reaction of the group to the global economy. The fund could provide some protection against lower energy prices, as it invests in companies that would benefit from the lower prices in addition to E&P companies. The fund saw the discount widen during the forth quarter. The current discount of 12.85 is below the fund’s 1 year average and could offer an opportunity. The widening discount in the fourth quarter also points to some tax loss selling in the fund, which could drive a rebound early in 2015. An in depth profile of SZC is available here . The Petroleum & Resources Corporation (NYSE: PEO ) has been around since 1929 and is the oldest and probably the best known closed end fund in the group. The fund offers the lowest expense ratio in the group. PEO has shown strong longer term performance and provided more downside protection than its peers 2014. The current 13.50% discount to NAV combined with the 7.93% distribution (mostly made up of capital gains) makes this fund an attractive potential addition at current levels. The Tortoise Energy Independence Fund was the worst performing CEF during the fourth quarter. NDP’s focus on North American exploration and production companies investing in shale resources hurt. Shale focused companies were some of the worst performers in the fourth quarter. NDP has a relatively aggressive portfolio due to its focus on shale E&P companies. The fund has the widest discount to NAV in the group at 14.85% and offers an attractive distribution of 9.23%. The fund employs leverage but the ratio appears manageable. The focus on shale E&P companies could make this fund one of the more volatile energy CEFs. Investors looking for a fund with leverage to increasing oil prices should consider this fund. Like BGR, the VOYA Natural Resources Equity Income Fund uses an options strategy. However, IRR’s NAV performance has not impressed during the fund’s life. IRR does has the highest distribution in the group at 12.16%. IRR’s discount widened a bit in the fourth quarter but remains above its one year average. The moderate discount and poor long term performance track record reduces the attractiveness of this fund. Conclusion: Oil prices accelerated their slide in the fourth quarter. The slide in oil prices hurt energy stocks which ended the year as the worst performing sector. Energy stocks could rebound if the global economy picks back up or if the dollar stops its advance. Individual investors may look to add energy sector exposure to hedge their energy use. Energy CEFs with attractive discounts and high distributions are worth consideration for investors looking to add energy exposure. PEO has a long track record with solid performance. The 7.93% distribution and 13.50% discount looks attractive. SZC also looks attractive. It is a broader offering will benefit from domestic energy production and a global economic recovery. NDP is probably the riskiest of the group due to its focus on shale exploration and production companies. If investors are looking for a beta trade NDP’s 14.85% discount and -1.24 Z-score look attractive. The fund is unproven, but invests specifically in companies benefiting from energy production growth in North America. If oil prices rebound NDP could see the most benefit.