Tag Archives: open-xhr-start

Can Pharma ETFs Continue Their Uptrend In 2015?

The pharmaceutical sector, which had been witnessing several tax inversion deals over the last few months, is not likely to go down this route given the Sep 2014 notice issued by the U.S. Department of the Treasury. New rules imposed by the Treasury Department make such cross-border deals unattractive — in fact, companies like AbbVie (NYSE: ABBV ), Auxilium (NASDAQ: AUXL ) and Salix (NASDAQ: SLXP ) backed off from such agreements. However, mergers and acquisitions (M&As) will continue to play a major role and are not showing any signs of slowing down. Auxilium, which terminated its merger agreement with QLT (NASDAQ: QLTI ), will be acquired by Endo in the first quarter of 2015. Other acquisition deals announced recently include the upcoming acquisition of Cubist (NASDAQ: CBST ) by Merck (NYSE: MRK ) and that of Avanir (NASDAQ: AVNR ) by Japanese firm, Otsuka ( OTC:OSUKF ). Meanwhile, small bolt-on acquisitions will continue. In-licensing activities and collaborations for the development of pipeline candidates have also increased significantly. Therapeutic areas attracting a lot of interest include oncology, central nervous system disorders, diabetes and immunology/inflammation. The hepatitis C virus (HCV) market is also attracting a lot of attention. Immuno-oncology has been a key focus area this year as these therapies have the potential to change the treatment paradigm for cancer. Restructuring activities are also gaining momentum as large pharma companies are looking to cut costs and streamline their operations. Most of these companies are re-evaluating their pipelines and discontinuing programs which do not have a favorable risk-benefit profile. Another recent trend is the divestment/monetization of non-core assets so that the companies may focus on their core areas of expertise. Biosimilars and emerging markets are also a focus area. New Products Gaining Traction New products are steadily gaining traction and contributing significantly to sales. Drugs like Tecfidera (multiple sclerosis), Sovaldi (HCV), Olysio (HCV) and Imbruvica (cancer) are off to a strong start and represent significant commercial potential. So far in 2014, important product approvals include Esbriet and Ofev (idiopathic pulmonary fibrosis), Harvoni (HCV), Plegridy (multiple sclerosis), Keytruda (melanoma), Otezla (active psoriatic arthritis) and Dalvance and Sivextro (skin infections). Pharma ETFs in Focus Highlighted below are some pharma ETFs – ETFs present a low-cost and convenient way to get a diversified exposure to the sector. Powershares Dynamic Pharmaceuticals ETF ( PJP ) PJP, launched in Jun 2005 by Invesco PowerShares, tracks the Dynamic Pharmaceuticals Intellidex Index. The fund covers only health care stocks. The top 3 holdings include Eli Lilly (NYSE: LLY ) (5.22%), Gilead (NASDAQ: GILD ) (5.19%) and Celgene (NASDAQ: CELG ) (5.14%). The total assets of the fund as of Dec 9, 2014 were $1,511.7 million representing 27 holdings. The fund’s expense ratio is 0.58% while dividend yield is 0.42%. The trading volume is roughly 140,267 shares per day. SPDR S&P Pharmaceuticals ETF ( XPH ) XPH, launched in Jun 2006, tracks the S&P Pharmaceuticals Select Industry Index. This ETF covers pharma stocks with the top 3 holdings being Avanir Pharmaceuticals (5.09%), Auxilium Pharmaceuticals (4.52%) and Impax Laboratories (NASDAQ: IPXL ) (4.04%). Total assets as of Dec 9, 2014 were $1,114.72 million representing 35 holdings. The fund’s expense ratio is 0.35% and dividend yield is 0.57%. The trading volume is roughly 48,791 shares per day. iShares U.S. Pharmaceuticals ( IHE ) IHE, launched in May 2006, seeks investment results that correspond generally to the price and yield performance of the Dow Jones U.S. Select Pharmaceuticals Index. The fund mainly consists of pharma companies (88.38%). Biotech companies account for about 11.53% of the fund. The top 3 holdings of this fund are large-cap pharma companies are Johnson & Johnson (NYSE: JNJ ) (9.22%), Pfizer (NYSE: PFE ) (8.12%) and Merck 7.21%). The total assets of the fund as of Dec 9, 2014 were $850.8 million representing 43 holdings. The fund’s expense ratio is 0.43% with the dividend yield being 1.15%. The trading volume is roughly 30,863 shares per day. Market Vectors Pharmaceutical ( PPH ) PPH was launched in Dec 2011 and tracks the Market Vectors U.S. Listed Pharmaceutical 25 Index. The top 3 holdings of this fund are large-cap pharma companies – Johnson & Johnson (10.73%), Novartis (NYSE: NVS ) (9.73%) and Pfizer (7.64%). The total assets as of Dec 10, 2014 were $354.8 million representing 26 holdings. While the expense ratio is 0.35%, dividend yield is 1.54%. The trading volume is roughly 166,369 shares per day. Conclusion The worst of the patent cliff is over for the pharma sector which is slowly but steadily recovering from the impact of genericization. The NYSE ARCA Pharmaceutical Index is up 19.3% over the last year. Many companies, which had been struggling to post growth in the face of genericization over the past few years, are now on the recovery path. New products should start contributing significantly to results, and increased pipeline visibility and appropriate utilization of cash should increase confidence in the sector.
2 New Alternative ETNs Launched In December

A pair of new exchange-traded notes (ETNs) launched last month: One providing investors with the price return of a diversified basket of MLPs; the other a targeted-volatility and VIX “roll yield” strategy. ETNs, which are unsecured notes backed by the faith and credit of the issuer, trade on exchanges like shares of stock or ETFs. The Credit Suisse S&P MLP Index ETN (NYSEARCA: MLPO ) The Credit Suisse S&P MLP Index ETN debuted on December 2. It provides exposure to the price return of the S&P MLP Index, which includes both MLPs (master limited partnerships) and publicly traded LLCs (limited liability companies). Index components must be from either the energy sector or gas-utility sector, with market capitalizations of at least $300 million. The index is cap-weighted, but no constituent may constitute more than 15% of the total index, and constituents that account for more than 4.5% may not combine to account for more than 45%, as a group. Although the ETN launched last month, the index has been calculated live since September 6, 2007. For the five years ending November 28, 2014, the total return S&P MLP Index returned an annualized 17.80%, besting the S&P 500’s total return of 15.45%. However, the new Credit Suisse S&P MLP Index ETN provides exposure to only the price return of the index, which returned 11.18% for the five years ending 12/31/14. The wide difference between the total return and price return of the index is due to the large yield distributed by MLPs. The net-expense ratio of MLPO is 0.95%. Investors looking for a total return on the S&P MLP Index can look to the iPath S&P MLP ETN (NYSEARCA: IMLP ), which was launched in on January 3, 2013 and carries an expense ratio of 0.80%. As of November 28, the ETNs five largest holdings were Enterprise Product Partners (NYSE: EPD ), Energy Transfer Equity (NYSE: ETE ), Plains All American Pipeline (NYSE: PAA ), Magellan Midstream Partners (NYSE: MMP ), and Energy Transfer Partners (NYSE: ETP ). The new ETN joins the ranks of nine other alternative ETNs offered by Credit Suisse: Long/Short Equity Index ETN (NYSEARCA: CSLS ) Equal Weight MLP Index ETN (NYSEARCA: MLPN ) Merger Arbitrage Index ETN (NYSEARCA: CSMA ) Leveraged Merger Arbitrage Index ETN (NYSEARCA: CSMB ) Market Neutral Index ETN (NYSEARCA: CSMN ) Gold Shares Covered Call ETN (NASDAQ: GLDI ) The Credit Suisse Commodity Benchmark ETN (NYSEARCA: CSCB ) Silver Shares Covered Call ETN (NASDAQ: SLVO ) The Credit Suisse Commodity Rotation ETN (NYSEARCA: CSCR ) For more information about MLPO, read the fund’s prospectus . The ETRACS S&P 500 VEQTOR Switch ETN (NYSEARCA: VQTS ) The ETRACS S&P 500 VEQTOR Switch ETN launched on December 3. The ETN is linked to a volatility-targeted S&P 500 index strategy and a long/short VIX futures strategy. The VIX futures component is intended to capture VIX “roll yields” and volatility drops when allocated to short positions in VIX futures; and VIX upside during volatility spikes when allocated to long positions in VIX futures. The ETRACS S&P 500 VEQTOR Switch ETN tracks the performance of the S&P 500 VEQTOR Switch Index, which seeks to “simulate a dynamic portfolio that allocates between equity and volatility based on realized volatility in the broad equity market.” The index launched on November 17, 2014, and has no prior performance history. The ETN’s net-expense ratio is 0.95%. For more information, download a pdf copy of the fund’s prospectus .

Utilities ETF: XLU No. 1 Select Sector SPDR In 2014

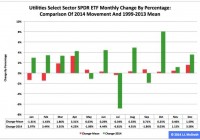
Summary The Utilities exchange-traded fund finished first by return among the nine Select Sector SPDRs in 2014. As it did so, the ETF posted the best annual percentage gain in its 16-year history. However, seasonality analysis indicates it could be facing a tough first quarter. The Utilities Select Sector SPDR ETF (NYSEARCA: XLU ) in 2014 ranked No. 1 by return among the Select Sector SPDRs that break the S&P 500 into nine chunks. On an adjusted closing daily share price basis, XLU rocketed to $47.22 from $36.68, a zooming of $10.54, or 28.74 percent. Accordingly, the ETF outdistanced its parent proxy SPDR S&P 500 ETF (NYSEARCA: SPY ) by an extraordinary 15.27 percentage points. (XLU closed at $47.35 Wednesday.) XLU also ranked No. 1 among the sector SPDRs in the fourth quarter, as it outpaced SPY by 8.28 percentage points. In addition, XLU ranked No. 1 among the sector SPDRs in December, as it outran SPY by 3.83 percentage points. Overall, XLU posted the best annual percentage return in its 16-year history: Its previous record was set in 2003, when it swelled 26.46 percent. XLU appears key to analysis of market sentiment based on the comparative behaviors of the Select Sector SPDRs . If XLU ranks near No. 1 by return during a given period, then I believe market participants are in risk-off mode; if XLU ranks near No. 9 by return over a given period, then I think market participants are in risk-on mode. Figure 1: XLU Monthly Change, 2014 Vs. 1999-2013 Mean (click to enlarge) Source: This J.J.’s Risky Business chart is based on analyses of adjusted closing monthly share prices at Yahoo Finance . XLU behaved a lot better in 2014 than it did during its initial 15 full years of existence based on the monthly means calculated by employing data associated with that historical time frame (Figure 1). The same data set shows the average year’s weakest quarter was the first, with a relatively small negative return, and its strongest quarter was the second, with an absolutely large positive return. The ETF’s October 8.03 percent gain was its sixth-highest monthly return ever. Figure 2: XLU Monthly Change, 2014 Versus 1999-2013 Median (click to enlarge) Source: This J.J.’s Risky Business chart is based on analyses of adjusted closing monthly share prices at Yahoo Finance. XLU also performed a lot better in 2014 than it did during its initial 15 full years of existence based on the monthly medians calculated by using data associated with that historical time frame (Figure 2). The same data set shows the average year’s weakest quarter was the first, with a relatively small positive return, and its strongest quarter was the second, with an absolutely large positive return. Clearly, this means there is no historical statistical tendency for the ETF to explode in Q1. Figure 3: XLU’s Top 10 Holdings and P/E-G Ratios, Jan. 7 (click to enlarge) Note: The XLU holding-weight-by-percentage scale is on the left (green), and the company price/earnings-to-growth ratio scale is on the right (red). Source: This J.J.’s Risky Business chart is based on data at the XLU microsite and Yahoo Finance (both current as of Jan. 7). In the wake of the sea change in bias at the U.S. Federal Reserve , away from loosening and toward tightening, XLU’s record-setting performance in 2014 kind of makes sense, at least in an equity market where share prices are primarily driven by the ebb and flow of asset purchases made by the central bank under one or another of its so-called quantitative-easing programs. It is worth mentioning in this context that the Fed announced the conclusion of purchases under its latest QE program Oct. 29 and that the ends of purchases under its previous two formal QE programs are associated with both a correction and a bear market in large-capitalization stocks, as evidenced by SPY’s dipping -17.19 percent in 2010 and dropping -21.69 percent in 2011. It is also worth mentioning that XLU’s big-time performance last year means that I, as a growth-and-value guy, see neither growth nor value in most of the utilities sector, as indicated by the above chart (Figure 3) and numbers released by S&P Senior Index Analyst Howard Silverblatt Dec. 31. At that time, Silverblatt pegged the P/E-G ratio of the S&P 500 utilities sector as 3.43. In the current environment, I therefore would be completely unsurprised should XLU continue to behave well in the current quarter, not on an absolute basis but on a relative basis (i.e., in comparison with the other Select Sector SPDRs and with SPY). On balance, the ETF may not produce gains, but it might produce losses smaller than those of its siblings. Disclaimer: The opinions expressed herein by the author do not constitute an investment recommendation, and they are unsuitable for employment in the making of investment decisions. The opinions expressed herein address only certain aspects of potential investment in any securities and cannot substitute for comprehensive investment analysis. The opinions expressed herein are based on an incomplete set of information, illustrative in nature, and limited in scope. In addition, the opinions expressed herein reflect the author’s best judgment as of the date of publication, and they are subject to change without notice.