Tag Archives: open-xhr-start

QJPN Borders On Being Too Good To Be True

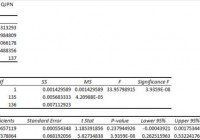
Summary I’m taking a look at QJPN as a candidate for inclusion in my ETF portfolio. The expense ratio is a bit high, but the diversification is moderate. The correlation with SPY appears low, and the overall risk level for a portfolio looks great. However, weak liquidity could be influence results. Despite the relatively short history on QJPN, I’ll keep it on my short list for international exposure. I’m not assessing any tax impacts. Investors should check their own situation for tax exposure. Investors should be seeking to improve their risk adjusted returns. I’m a big fan of using ETFs to achieve the risk adjusted returns relative to the portfolios that a normal investor can generate for themselves after trading costs. I’m working on building a new portfolio and I’m going to be analyzing several of the ETFs that I am considering for my personal portfolio. One of the funds that I’m considering is the SPDR MSCI Japan Quality Mix ETF (NYSEARCA: QJPN ). I’ll be performing a substantial portion of my analysis along the lines of modern portfolio theory, so my goal is to find ways to minimize costs while achieving diversification to reduce my risk level. What does QJPN do? QJPN attempts to provide results which are comparable (before fees and expenses) to the total return of the MSCI Japan Quality Mix Index. QJPN falls under the category of “Japan Stock”. Does QJPN provide diversification benefits to a portfolio? Each investor may hold a different portfolio, but I use (NYSEARCA: SPY ) as the basis for my analysis. I believe SPY, or another large cap U.S. fund with similar properties, represents the reasonable first step for many investors designing an ETF portfolio. Therefore, I start my diversification analysis by seeing how it works with SPY. I start with an ANOVA table: (click to enlarge) The correlation is about 44%, which is phenomenal for Modern Portfolio Theory. The extremely low correlation makes it much easier to mix the ETF into a portfolio and take advantage of the benefits of diversification. My goal is risk adjusted returns, and my method is minimizing risk. Standard deviation of daily returns (dividend adjusted, measured since June 2014) The standard deviation is very reasonable. For QJPN it is .8159%. For SPY, it is 0.7232% for the same period. SPY usually beats other ETFs in this regard, and the low correlation with SPY makes the higher standard deviation acceptable. Short time frame Investors should be aware that this is a substantially shorter time frame than I usually use. I would like to have about 3 years of data on the ETF for running statistics and half of one year is short enough to introduce sampling errors. In statistics, the minimum sample size is generally 30 so over 130 days of trading returns may seem sufficient, but I would caution investors to take this with a grain of salt. Liquidity concern The average volume comes in at just under 2000 shares. That’s a potential problem for investors that need liquidity and for running correlation values. I checked the dividend adjusted closing values for each day and there were very few times that the change was 0.00%, which means the low volume of trades was not the only factor in the low standard deviation. For statistical validity, I’m more concerned about the relatively short time frame that I have available than the number of shares trading each day. For an investor concerned about spreads and liquidity, the low number of shares trading could be the bigger concern. Mixing it with SPY I also run comparisons on the standard deviation of daily returns for the portfolio assuming that the portfolio is combined with the S&P 500. For research, I assume daily rebalancing because it dramatically simplifies the math. With a 50/50 weighting in a portfolio holding only SPY and QJPN, the standard deviation of daily returns across the entire portfolio is 0.6553%. If an investor wanted to use QJPN as a supplement to their portfolio, the standard deviation across the portfolio with 95% in SPY and 5% in QJPN would have been .7063%. While the low correlation makes very large positions look quite appealing, I wouldn’t want to risk my money on those statistics holding. However, the low correlation and reasonable standard deviation make this a strong contender for a position in my portfolio, even if I have to limit the exposure to something much smaller than the statistics would have suggested. Due to the potential for the low trading volumes and short time frame to distort the statistics, I will want more data before making a final decision on the ETF. So far, I am definitely considering it. Why I use standard deviation of daily returns I don’t believe historical returns have predictive power for future returns, but I do believe historical values for standard deviations of returns relative to other ETFs have some predictive power on future risks and correlations. Yield & Taxes The SEC yield is 1.37%. That is too weak for a retiring investor to live off the yield, but the ETF still could merit a small position as part of a rebalancing plan to reduce the overall risk level in the portfolio is the investor was certain he or she would not have liquidity needs that would force them to sell. I’m not a CPA or CFP, so I’m not assessing any tax impacts. Expense Ratio The ETF is posting .30% for an expense ratio. I want diversification, I want stability, and I don’t want to pay for them. The expense ratio on this fund is slightly higher than I want to pay for an equity fund, but it isn’t enough to disqualify the ETF from consideration. Market to NAV The ETF is at a .29% premium to NAV currently. Premiums or discounts to NAV can change very quickly so investors should check prior to putting in an order. I wouldn’t want to pay a premium greater than .1% when investing in an ETF, unless I could find a solid accounting reason for the premium to exist. This premium looks small enough that I think I could enter into a position with a limit buy order that removed the premium. Largest Holdings The diversification within the ETF is moderate. Normally I want more diversification, but if the correlation and standard deviation hold up over a longer time period, I wouldn’t have any problem with the level of diversification in the ETF. (click to enlarge) Conclusion I’m currently screening a large volume of ETFs for my own portfolio. The portfolio I’m building is through Schwab, so I’m able to trade QJPN with no commissions. I have a strong preference for researching ETFs that are free to trade in my account, so most of my research will be on ETFs that fall under the “ETF OneSource” program. QJPN is going to be on my short list (for now) for potential inclusion in my portfolio as part of my international exposure. If QJPN continues to look better than other international ETFs under modern portfolio theory I will extend my analysis to look for other ETFs with similar holdings and a longer trading history so if the data on those ETFs support the statistics so far on QJPN.
Watch Your Step When Using Bond Ladder ETFs

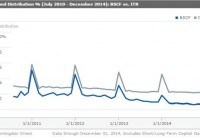
By Thomas Boccellari Institutional investors, such as insurance companies and pension plans, have long used their bond portfolios to match their interest and principal repayments with their cash flow needs. One way to accomplish this is to construct a portfolio of bonds with different maturity dates that correspond with the investor’s obligations. This is known as a bond ladder, and it can help mitigate interest-rate and liquidity risk. However, building a bond ladder can be expensive and time-consuming. Because bonds are traded over the counter, bid-ask spreads may be wide. Additionally, brokerage firms can charge high commissions for bond trades. Bond ladder exchange-traded funds can help solve some of these problems. Because bond ladder ETFs, such as Guggenheim Investment’s BulletShares and iShare’s iBonds, hold bonds from upwards of 100 different issuers, credit risk is more evenly spread around a portfolio. Further, because they don’t have lofty purchase minimums, like many bonds available through a broker, investors can get exposure to a variety of different bonds with very little capital. Strategies for Using Bond Ladder ETFs Within a Portfolio Suppose an investor knows that she will need to pay for a wedding and a down payment on a new home in one and three years, respectively. The investor may wish to set aside a certain amount of capital to pay for those future obligations. In the meantime, however, the investor would like to collect interest on her capital. If the investor buys a traditional bond mutual fund or ETF, she runs the risk of not getting back her original investment because of potential interest-rate movements that could push bond prices lower. To mitigate this risk, she could buy iShares iBonds September 2016 AMT-Free Municipal Bond (NYSEARCA: IBME ) and iShares iBonds September 2018 AMT-Free Municipal Bond (NYSEARCA: IBMG ) to match her portfolio’s maturity dates with her corresponding spending needs. This would allow her to collect income while getting her full investment principal back to pay for her obligations. Laddered bond ETFs also give investors better control over their portfolio duration, or interest-rate sensitivity. For example, suppose an investor wants exposure to investment-grade corporate bonds but is afraid that a traditional corporate-bond ETF, such as SPDR Barclays Intermediate Term Corporate Bond ETF (NYSEARCA: ITR ) , has too much exposure to bonds maturing between five and 10 years from now and is too exposed to interest-rate movements. To mitigate this risk, she could use Guggenheim BulletShares 2015/2016/2017/2018 Corporate Bond ETF (NYSEARCA: BSCF ) / (NYSEARCA: BSCG ) / (NYSEARCA: BSCH ) / (NYSEARCA: BSCI ) to give an overweighting to bonds with maturities of less than five years from now and reduce her portfolio’s overall exposure to interest-rate risk. Bond Ladder ETF structure Like an individual bond, a bond ladder ETF has a predefined maturity date. The fund can do this because it only buys bonds maturating in the year the ETF terminates. For example, Guggenheim BulletShares 2015 Corporate Bond ETF ( BSCF ) tracks an index that targets investment-grade corporate bonds maturing in 2015. The fund terminates (matures) on Dec. 31, 2015. At maturity, the fund’s assets are returned to investors. Because the fund has a predefined maturity date, it will behave differently from traditional bond ETFs. A traditional bond ETF targets a consistent range of bonds. For example, ITR targets U.S. dollar-denominated bonds with maturities between one and 10 years. During the fund’s monthly rebalancing, it will buy new bond issuances that have maturities between one and 10 years and sell bonds that no longer meet the maturity requirement. This keeps the fund’s duration relatively consistent. On the other hand, a laddered bond ETF only replaces bonds that are called. Otherwise, it holds securities until maturity or the fund’s termination date, which is usually in the same year that all of its bonds mature. This means that the laddered bond ETF’s duration will decline as the fund approaches maturity. While one would expect a laddered bond ETF to make consistent interest payments throughout its life, like an individual bond, this has not been the case. In fact, for funds within the BulletShares and iBonds families, monthly distributions have decreased at a similar rate to that of a traditional bond fund over the trailing five years through December 2014. Laddered bond ETFs’ inclusion of callable bonds could help explain this. Issuers can buy (call) back callable bonds if their price exceeds a predetermined level, which typically occurs when interest rates fall. The fund then has to replace these bonds with lower-yielding alternatives. Callable bonds are not the only problem. Companies have also refinanced their debt because of prolonged low interest rates. This has the same effect as when a bond is called. Further, if a bond matures, is called, or is redeemed after the final rebalancing, the bond is not reinvested in a corporate bond. It is instead kept in Treasury bills until the fund terminates. For Guggenheim BulletShares, the final rebalancing date is July 1 of the termination year. Therefore, if a bond matures, is called, or is redeemed after July 1 of the fund’s termination year, investors will lose more interest and not have the ability to reinvest their principal. This also means that investors won’t get back exactly their original principal plus interest because not all bonds are held until the fund’s maturity. At the start of 2014, BSCF had 285 bonds. By the end of 2014, 23 bonds dropped out because they were called or redeemed early. This had an impact on the fund’s distribution amount. Over the life of the fund, it saw its distribution percentage decline in a similar fashion to that of ITR. The difference in distribution percentage between BSCF and ITR is roughly equivalent to the difference in the funds’ expense ratios. Distributions are higher in December of each year because both funds include both the December and January distributions in December. Lastly, investors need to be aware of the additional costs associated with buying additional funds. If an investor decides to build a five-bond ladder, there will be at least five transactions. These costs can also increase if investors decide to roll their terminated ETFs’ assets into new funds. For investors who are comfortable with the structural risks of these funds, they are a cheaper, easier to build, and safer alternative to individual bond ladders. But traditional bond ETFs may be a better choice for investors looking for aggregate exposure to a particular type of bond or maturity range. Disclosure: Morningstar, Inc. licenses its indexes to institutions for a variety of reasons, including the creation of investment products and the benchmarking of existing products. When licensing indexes for the creation or benchmarking of investment products, Morningstar receives fees that are mainly based on fund assets under management. As of Sept. 30, 2012, AlphaPro Management, BlackRock Asset Management, First Asset, First Trust, Invesco, Merrill Lynch, Northern Trust, Nuveen, and Van Eck license one or more Morningstar indexes for this purpose. These investment products are not sponsored, issued, marketed, or sold by Morningstar. Morningstar does not make any representation regarding the advisability of investing in any investment product based on or benchmarked against a Morningstar index.

Time In, Not Timing, Is Everything

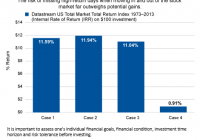
Editor’s note: Originally published on December 22, 2014 Market timing can be a perilous game that long-term investors should avoid playing. It’s difficult to get it right. And the time spent on the sidelines waiting for “the right moment” presents big risks to your portfolio. Last week proved to be a roller-coaster ride for investors and an important reminder for investors to stay the course in the face of short-term market gyrations. Stocks dropped dramatically in the first half of the week, as the price of oil continued to fall and Russia raised interest rates in a desperate attempt to defend the ruble. That all changed on Wednesday afternoon, when the FOMC announcement halted the selloff. The announcement and accompanying projections appeared to soothe markets and actually change the mindset of investors, sending stocks sharply higher. Heading for the Exits Unfortunately, many investors had sold out of stock funds by then and missed that rebound. In fact, according to EPFR Global data, the week ending Wednesday saw the biggest outflows from equity funds since 2005. This is troubling because it shows that investors continue to let their emotions get the better of them. Moving in and out of the stock market based on the headlines is hazardous to the health of investors’ long-term portfolios, and puts financial goals at risk. In light of last week’s market tumult and the response from investors, I feel compelled to repeat the findings of a study published in early 2014 by my colleagues on the Economics & Strategy team at Allianz Global Investors. Their research shows the dangers of market timing. Specifically, the study looked at the performance of the Datastream US Total Market Total Return Index from 1973 through the end of 2013, comparing four different investment approaches: 1. Investing $100 at the start of the first year and adding an additional $100 at the start of each subsequent year. 2. Investing $100 on the day of the lowest index level of the year and adding an additional $100 each year on the day of the lowest index level of that year—the best day of the year to invest. 3. Investing $100 on the day of the highest index level of the year and adding an additional $100 each year on the day of the highest index level of that year—the worst day of the year to invest. 4. Investing $100 each year at the start of the year as in the first approach, but assuming one misses the returns of the best three trading days in each year. The results provide a strong cautionary tale: Time in the market beats timing the market. The returns are actually quite similar in the first three hypothetical scenarios, ranging from 11% to 11.9% in annualized terms. However, the fourth hypothetical produces dramatically lower performance: an annualized return of just under 1%. In other words, it doesn’t matter when you get in, it matters that you stay in for the long haul. Equally compelling are the results of Morningstar’s research on the disparity between mutual fund returns and mutual-fund shareholder returns. Over the 10 years ending Dec. 31, 2013, Morningstar found a widening performance gap between investors and the funds themselves. That makes sense given that investors became extremely risk averse in the wake of the global financial crisis, shunning stocks even as they rebounded. The scars from the crisis clearly run deep and have exacerbated investors’ emotional responses to market events. Breaking down the numbers, Morningstar shows that the typical investor gained 4.8% on an annualized basis over that 10-year period versus 7.3% annualized for the typical mutual fund. The gap is caused by the investor’s time (or lack thereof) in the stock market. In fact, market timing takes a bigger bite out of investor returns than fees for active management. Poor Timing Mutual fund flows in 2012 reveal the perils of market timing. Flows in 2012 Show Poor Timing 2012 Flows ($ Billion) Subsequent Return 2013 (%) U.S. Equity -93,677 35.04 Sector Equity 3,264 18.90 International Equity 13,604 13.19 Allocation 20,399 15.40 Taxable Bond 269,760 0.15 Municipal Bond 50,313 -3.40 Alternative 14,781 -4.85 Commodities 1,365 -9.10 Source: Morningstar. Looking ahead to 2015, we expect more market turbulence and rotation among different styles and asset classes. In this type of environment, it’s critical that investors remember the importance of developing a long-term plan in an emotional vacuum—and adhering to it even when the world around us seems to be panicking. In short, investors don’t plan to fail, but they often fail to plan. The key is to have a plan—and then stick with it. These are words to invest by as we prepare for 2015 and beyond.