Tag Archives: open-xhr-start

3 Investments Jeffrey Gundlach Loves In 2015

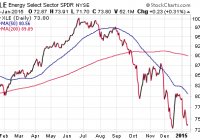
Summary This article summarizes Jeffrey Gundlach’s “2015 Market Outlook” webcast. He spoke favorably about the underlying fundamentals in the strong U.S. dollar despite its rapid ascent last year and how currency trends can be “persistent and long lived”. Gundlach also spoke favorably about gold as a flight to quality instrument. Yesterday I listened to Jeffrey Gundlach’s “2015 Market Outlook” webcast along with much of the financial community. Gundlach has certainly peaked in his notoriety as one of the most prestigious bond fund managers and continues to draw fascination for his timely insights into global economic machinations as well. For full disclosure: I have owned the DoubleLine Total Return Fund (MUTF: DBLTX ) for myself and my clients for many years now as well as various other Doubleline funds along the way. I have found Gundlach’s team focus on security selection, duration exposure, risk management, and overall total return to be a far more attractive value proposition than owning a passive index such as the iShares U.S. Total Bond Market ETF (NYSEARCA: AGG ). One of the themes that Gundlach noted throughout his call is that the U.S. consumer is focused on the positive impact of the oil space, while Wall Street has yet to fully embrace the impending negative aspects. He noted that currently 35% of the S&P 500 capital expenditures are represented in energy companies, of which there is a probability this spending could completely evaporate later this year. That could ultimately lead to employment cuts, potential bankruptcies for leveraged energy companies, and deeper impact across the high yield bond spectrum. The Energy Select Sector SPDR (NYSEARCA: XLE ) has certainly been pricing in some of those eventualities as it continues to decline with crude oil prices. Despite some modest rallies, XLE now stands at more than 25% off its 2014 high and recent probed down to new lows as angst sets in. The one thing I have noted recently is how much buying has been on throughout the energy complex since the decline began. At this juncture you would typically expect widespread distribution rather than accumulation in energy ETFs. He also spoke favorably about the underlying fundamentals in the strong U.S. dollar despite its rapid ascent last year and how currency trends can be “persistent and long lived”. However, he candidly stated that “I know it’s a crowded trade. I’m as uncomfortable as everybody else.” The PowerShares U.S. Dollar Bullish Fund (NYSEARCA: UUP ) has been a big mover as declines in the euro and Japanese yen continue to fuel a flight to the dollar. The overarching themes of lackluster growth and quantitative easing efforts in these foreign developed countries make the U.S. dollar, and concomitantly U.S. treasuries, an attractive trade for overseas dollars. Gundlach also spoke favorably about gold as a flight to quality instrument. He thinks that gold will move higher as the stress to the financial system from the repercussions of oil deflation takes hold. We have already seen an uptick in the SPDR Gold Shares ETF (NYSEARCA: GLD ) since the beginning of 2015 as it comes off multiple years of heavy declines. This sector certainly bears watching as volatility in both stocks and commodities may favor investors seeking out hard assets with non-correlated returns as a hedge against other investments. On interest rates, Gundlach noted how far off economists were in predicting the outcome of the 10-Year Treasury note yield at the end of 2014. He believes that the trend in higher bond prices (lower bond yields) will continue in the first half of this year and will probably overshoot most investors’ expectations. The strong price trend in the iShares 7-10 Year Treasury Bond ETF (NYSEARCA: IEF ) has continued to stretch further than many believed possible, and has gone almost vertical since the beginning of 2015. On a relative basis the U.S. 10-Year Yield near 1.80% is still far more attractive than other developed nations in Europe and Japan. There is obviously no concern right now for a rate hike scenario being priced into the market. Instead, investors are focusing on sheltering their portfolio from low global yields and a volatile stock environment. Other bullets of caution worth mentioning: Gundlach did not speak favorably about bitcoin and noted it was virtually the worst performing asset class of 2014. (See what I did there with “virtually”?) The stock market has been positive for the last 6 years straight (2009-2014). Stocks never been up 7 years in a row since 1871. He still feel that Treasury inflation protected securities ( OTC:TIPS ) are for losers because near-term inflation expectations are actually pointing towards negative trends. He did note that they are cheap on a relative basis, but the overriding argument to own them is flawed in this market. Avoid the iShares TIPS Bond ETF (NYSEARCA: TIP ) for the time being. He is “afraid of mall REITs” due to more retail sales moving online and shrinking need for conventional shopping centers. He noted that “It’s a little late to buy the Shanghai (China)” after last year’s run and that you probably don’t want to own European stocks or bonds right now. Also beware of leveraged ETFs with respect to compounding and tracking error over time. He noted the big decline in the DirexionShares Daily Gold Miners Bear 3x Shares (NYSEARCA: DUST ) for 2014, despite the fact that the Market Vectors Gold Miners ETF (NYSEARCA: GDX ) was down heavily last year as well. The Bottom Line No one man knows the fate of the markets and most will probably take these comments with a grain of salt. However, those that take a wider macro view in their investment analysis may be intrigued by some of the correlations that were noted in this presentation. Many of the observations Gundlach made in his monologue mirror our own thoughts on the market at this juncture. Our most recent January 2015 client memo outlined several salient points on interest rates, volatility, and areas of perceived value as well.
How My Value Investing Strategies Performed In 2014

Summary 2014 was a tough year in the markets but there was a strategy that outperformed the market with a gain of 24.5%. Quarterly breakdown of results for the 15 different value investing strategies I follow are provided. A detailed look at the stock portfolio that outperformed in 2014. In ancient Roman mythology, there is a god with two faces. His name is Janus, and with two faces, he looks in both directions representing the past and future. It’s also where the word January came from. Although January 2015 is fully under way, it’s appropriate because we are still at a stage of looking back at 2014, while also looking at what lies ahead in 2015. Now one of the very last tasks of the year (or first of the year) that I do is to go through all the performances of the value stock screeners and see what worked and what didn’t. I don’t bother with gathering results for all different asset classes and sectors because there are plenty of people who are better than me at this. It’s easier to leverage the work of others and to put my value strategies into context. Here’s the best chart I came across showing the performance of the major asset classes. (click to enlarge) Yearly Asset Performance Chart (Credit: awealthofcommonsense.com ) Because my focus has always been on value stocks, the stocks shown on the value screens all fall into the large, mid and small cap boxes above. But most of those stocks should be categorized into the small cap group which managed 3% on the year. So in the grand scheme of things, no matter how good the strategy or quality of the company was, small caps had a rough 2014. It goes to show how difficult it is to beat the market. The market isn’t going to award you easily just because the company has strong fundamentals. What works one year, may not the next and it’s a test of conviction and temperament to see it through. That’s why having a clear process to buy and sell stocks and to focus on creating long term wealth is important over short-term gains. Sure it feels good when you beat the market, but that’s something you can leave to fund managers who are judged based on their quarterly or yearly results. You and I have the luxury of looking 5 or 10 years down the road and comparing performance then. A few bad years after having achieved 200% vs. the market’s 100% over a 10-year period isn’t important. The end goal is to outperform the market over the long run because you aren’t trying to invest for a few months and then call it quits. With that in mind, here are the final 2014 results for each of the Value Screeners . 2014 Value Screener Results Before getting into the results, a very common question that I receive daily is whether the OSV Analyzer will screen for stocks and tell people what to buy and sell. I want to start by clearing up that these strategies are not created with the OSV Analyzer. The OSV Analyzer is a deep fundamental analysis and valuation tool. A tool to drill down deeply into a single company quickly instead of just scratching the surface and looking at basic stats. Screening will come in the future. With that out of the way, here are the results. (click to enlarge) Out of 15 value strategies, only 4 managed to outperform the market at the end of the year. The outperforming strategies ( Altman , Graham , Piotroski ) were the ones that contained a lot of mid and large caps. With the Altman Z value screen leading the pack this year, here’s a look at the 20 stocks that made up the list from the beginning of the year and how each performed. (click to enlarge) There are stocks that I definitely wouldn’t purchase, but that’s the beauty of mechanical investing. It’s simplified down to how well you create a strategy and stick with it. This reduces many of the variables that go into individual stock picking. However, I still find it difficult to give up total control of my portfolio. I prefer to further filter the list with my analyzer because screeners still make mistakes. Manual analysis is also required because there are things like off balance sheet items screens can’t recognize and qualitative events that can’t be simulated. But if this was something that I want to follow with real money, I’ll want to create a new account with at least $20k instead of using money from my existing portfolio. Not the Time to Invest in US Net Nets One sure thing about 2014 was that it wasn’t a good year for net nets. It’s especially clear looking at the Net Net performance. Since the results are all US listed stocks, the horrible performance isn’t surprising. When markets are hot, stay away from employing a pure USA net net investing strategy. You need to expand to international net nets if you want to stick with Graham’s net nets. But right now, there aren’t many US net nets that you should be investing in. The ones you see floating around the stock market have serious issues. The official screeners identified around 5-6 stocks at the start of the year and the minimum that I test with is always 20 stocks. For any mechanical strategy where you have to trust the theory and the system, holding 5-6 stocks is going to get you killed. The full 20 stocks are required for the portfolio to be diversified enough for each strategy to work over the long run. As I showed previously , when the number of net nets increase, it’s definitely a sign that the market is getting cheaper and that’s the time to be loading up on good net nets. Just not now. In the next post, I’ll be listing the official stocks for each screen that will be tracked for 2015. It features a list of 225 value stocks you can download and to get ideas.

Time To Embrace Old Tech ETFs…Again

Summary Investors should look at old technology names for sturdy growth. A tech ETF with heavy weights in established, mature tech companies. Why invest in tech, particularly in the old guard. By Todd Shriber & Tom Lydon It was a prominent theme in 2014, though not one widely embraced by many exchange traded fund investors, but old school technology companies worked and did so in significant fashion. Amid various bouts of volatility and routs for Internet and social media funds, ETFs with an emphasis on the tech sector’s old guard shined bright. That includes the iShares U.S. Technology ETF (NYSEArca: IYW ) , which jumped 19.5% in 2014, topping the S&P 500 by 600 basis points in the process. Tech analysts point to sturdy tech names like Apple (NASDAQ: AAPL ) and Microsoft (NASDAQ: MSFT ), well-established companies that generated steady growth. Apple and Microsoft combine for 29.6% of IYW’s weight and the ETF’s 18.5% Apple allocation is one of the largest among ETFs that hold shares of the iPhone maker. Old tech and IYW could repeat last year’s heroics in 2015. Said BlackRock Global Investment Strategist Heidi Richardson in a recent note: I like mature technology companies-think large established brands like Intel (NASDAQ: INTC ), IBM (NYSE: IBM ) and Oracle (NYSE: ORCL ). These companies can use healthy cash balances to unlock shareholder value, are more likely to fare well if the Fed starts raising rates as expected this year and stand to benefit from continued improvement in the U.S. economy. Intel, IBM and Oracle combine for 13.7% of IYW’s weight. Tech’s durability in rising rates environments is an important consideration, particularly at this point in an aging bull market and amid expectations that the Federal Reserve will boost rates later this year. Said J.P. Morgan Asset Management in a research piece out earlier this year: Dispersion between sector valuations should continue to grow. For example, technology stocks appear attractive based on both forward and trailing P/E ratios when compared with their long-run histories. In contrast, the utilities sector, which many have used as a bond substitute, looks expensive on both measures. Tech’s increased credibility as a legitimate dividend destination also boosts the allure of ETFs like IYW. In 2014, the average dividend increase from Apple, IBM, Cisco (NASDAQ: CSCO ) and Qualcomm (NASDAQ: QCOM ) was 14%. Importantly, the tech sector has ample room for dividend growth. Adds Richardson: Some industry-leading companies have been hoarding cash. Consider that four information-age bellwethers―Apple, Microsoft, Google and Cisco―possess a combined $345 billion in cash. And the overall tech sector holds more than half of total corporate cash reserves in the U.S. With strong balance sheets, these companies are well-positioned to deliver returns through share repurchases, dividend increases and mergers and acquisitions. The $4.5 billion IYW has a trailing 12-month yield of 1.13%. iShares U.S. Technology ETF (click to enlarge) Tom Lydon’s clients own shares of Apple.