Tag Archives: open-xhr-start

Inside HACK: The Sought-After Cyber Security ETF

The cyber security industry has gained immense popularity in recent years and is the fastest-growing corner of the broad technology space. This is because cyber-attacks on enterprises and government agencies are widespread with growing Internet usage, raising the need for more stringent cyber security from hackers. Hacking has become more sophisticated, dangerous and harder for companies (and even governments) to stop. According to the report from the Global State of Information Security Survey 2015, cyber attacks across the globe have risen about 66% over the past five years and 48% from 2013. Some of the well-known companies in the recent spate of data breaches include Target (NYSE: TGT ), eBay (NASDAQ: EBAY ), Home Depot (NYSE: HD ), AT&T (NYSE: T ) and JPMorgan Chase (NYSE: JPM ). The situation will likely to worsen in 2015, as hackers will continue to adopt advanced techniques and strategies to infiltrate networks hiding their tracks. Solid Long-Term Prospects As per McAfee, cyber-warfare and espionage attacks are expected to increase in frequency. Attacks on Internet of Things (IoT) devices will rise rapidly due to whopping growth in the number of connected objects, poor security and the high value of data on IoT devices. And new mobile technologies will allow more mobile attacks. Growing awareness for the protection against these cyber threats will continue to propel demand for spending on information security. According to Gartner, global security spending will increase to $76.9 billion in 2015 from the expected $71.1 billion in 2014. Most of the growth will likely come from the rapid adoption of mobile, cloud, social and information technologies. Another data from ABI research showed that global cyber-security spending would reach $109 billion by 2020. Investors could easily tap the cyber-security spending boom and rising demand in a basket form. Investors should note that there is currently one ETF – PureFunds ISE Cyber Security ETF (NYSEARCA: HACK ) – which offers exposure to those companies that ensure the safety of computer hardware, software, networks and fight against any sort of cyber malpractices. The fund provides a good opportunity for investors to play the niche area of cyber security. This is especially true as it has been getting the first-mover advantage and has accumulated $157 million in AUM in just two months of debut while surging 3.6% in the same period. Average daily volume is solid as it exchanges nearly 227,000 shares in hand. Given this, it might be worth it to shed some light on this ETF and its holdings for those who are unfamiliar with the product, but are thinking about jumping in on the space. Below, we highlight some of the key details regarding HACK, which made it one of the fastest-growing and most successful ETFs of last year. HACK in Focus The ETF tracks the ISE Cyber Security Index, holding 30 securities in its basket. It is well spread out across components as each security holds no more than 5.01% of total assets. Ahnlab, Infoblox (NYSE: BLOX ), and Fireeye (NASDAQ: FEYE ) occupy the top three positions in the basket. From an industrial look, software and programming accounts for nearly two-thirds of the portfolio while communication equipment and Internet mobile applications round off the top three with a double-digit allocation each. In terms of country exposure, U.S. firms take the top spot at 72%, followed by Israel (12%), the Netherlands (5%), South Korea (5%), Japan (4%), Finland (2%) and Canada (1%).
Taking ETF Trades To The Next Level

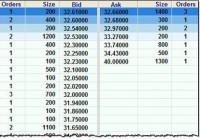
Experienced investors know the theory: ETFs are supposed to trade very close to their net asset value (NAV). And most of the time they do. But this week my PWL Capital colleague Justin Bender and I encountered a glaring exception that could have had expensive consequences. On Monday, Justin and I wanted to sell the iShares U.S. Dividend Growers Index ETF (CUD) in a client’s account. It was a large trade: more than 5,000 shares, which worked out to over $160,000. As we always do before making such a trade, we got a Level 2 quote, which reveals the entire order book. In other words, it tells you how many shares are being offered on the exchange for purchase or sale at various prices. By contrast, a Level 1 quote-the type normally available through discount brokerages-only tells you how many shares are available at the best bid and ask prices. If an ETF’s market maker is doing its job, there should be thousands of shares available at the best price. But we were surprised to find the Level 2 quote looked like this: Source: Thomson ONE Let’s unpack this. As sellers, we looked at the “Bid” column, and the best price (at the top of the column) was $32.61. But we’d be able to sell a mere 200 shares at that price, as revealed in the “Size” column to the left. We could unload another 400 for just a penny less, but after that the prices plummeted. Had we placed a limit order to sell 5,000 shares for $32.60 (one cent below the best bid price), we likely would have seen only 600 shares get sold. But that would have been a minor inconvenience compared to what might have happened if we’d placed a market order. Remember, a market order does not specify a minimum price you’ll accept when selling: it simply tells the exchange you will take whatever is being offered. Assuming a market order for 5,000 shares would have been filled according to the prices above, we would have received as little as $31.65 on the last few hundred shares-almost a full dollar lower than the best bid price. The average price for that market order would have been just $32.23, netting us proceeds of $161,150. Had we been able to sell all 5,000 shares at the best bid price-which is what we’d normally expect-we would have received almost $2,000 more . As you can imagine, we did not place this trade for our client. When market makers take a holiday This lack of depth in an ETF’s order book is very unusual. Even if an ETF is not frequently traded , market makers ensure that thousands of shares are available for purchase or sale at a price very close to NAV. So what was the reason for this anomaly? We can’t be sure, but Justin suspected it was because U.S. markets were closed on Monday (it was Martin Luther King, Jr. Day) while the TSX remained open. CUD is a Canadian-listed ETF, but its underlying holdings are U.S. stocks that were not trading that day: this would have made it more difficult for the market makers to determine the NAV of the fund. Indeed, the lot sizes were so small it’s unlikely they were posted by market makers at all: they may simply have been from individual investors. To test that idea, we got a Level 2 quote for another Canadian ETF that holds U.S. stocks: the Vanguard U.S. Total Market (VUN) . Sure enough, this one showed little market depth as well. Had you tried to sell more than 400 shares (or buy more than about 1,300) you may have seen your order filled at a surprising price. I checked the Level 2 orders for both ETFs again on Tuesday and the situation was completely different. Both funds had 20,000 to 30,000 shares available within a penny of the best bid and ask prices. Lessons learned This was a big trade that most retail investors would never make. But there important lessons from our little adventure that apply to anyone who uses ETFs. First, it’s the most dramatic example I’ve seen for why you should never use market orders . In this situation, a market order would have got you into trouble had you tried to trade as little as $20,000. On a very large trade like ours, it might have been a disaster. Second, avoid trading foreign equity ETFs when the underlying markets are closed. There are several American holidays when the Canadian market remains open, and these are not the days to be making large trades in ETFs that hold U.S. stocks. If you’re making a significant trade in an international equity ETF, it’s also a good idea to pay attention to time zone differences . Finally, if you have a large portfolio, consider subscribing to a service that provides Level 2 quotes. Check with your brokerage to see what is available, because practices vary a lot. Scotia iTRADE provides these free upon request, for example, while RBC Direct Investing and TD Direct Investing offer them as part of their Active Trader programs, and others such as Questrade charge a fee.

Vanguard Set To Move Into Muni Bond ETF Space

Vanguard Group, known for its low cost offerings, plans to make inroads to the increasingly popular muni bond ETFs space. Vanguard’s entry appears well timed, as the muni bond ETFs space has been on a roll since last year. In fact, the overall muni category managed to secure the third best position in 2014 having added 8.7%, its three-year highest. It’s not that the issuer is entirely new to munis. Presently, there are 12 actively managed Vanguard muni-bond funds worth $140 billion. The issuer expects the fund to be up for sale by the end of June. The fund will trade under the name of Vanguard Tax-Exempt Bond Index Fund . The Proposed Fund in Focus As per the SEC filing , the fund looks to track the performance of the investment-grade U.S. municipal bond market. The goal will be achieved by tracking the S&P’s National AMT-Free Municipal Bond Index. The index includes bonds having a minimum term to maturity greater than or equal to one calendar month. The “investor” share class will have to spend 0.2% in annual fees to own the fund. How Does it Fit in a Portfolio? Municipal bonds are great picks for investors seeking a steady stream of tax free income. Usually the interest income from munis is exempt from federal tax and sometimes even state taxes, making it especially attractive to investors in the high tax bracket looking to reduce their tax liability. The proposed fund too looks to follow munis that have their interests excused by U.S. federal income taxes and the federal alternative minimum tax (AMT). However, investors should note that tax-free bonds yield lower than taxable bonds. With the increase in the U.S. taxes, demand for municipal bonds has grown by leaps and bounds among high earners. Can it Succeed? There are quite a number of choices in the municipal bond space with iShares National AMT Free-Muni Bond Fund (NYSEARCA: MUB ) being the highest grossing ETF with about $4.2 billion. MUB tracks the S&P National AMT-Free Municipal Bond Index to provide exposure to a basket of 2,458 investment grade securities. The average maturity for the fund stands at 5.51 years, while duration is 6.33 years. The fund has a 30-day SEC yield of 1.58% and charges 25 basis points as expenses per year. Interestingly, the newly filed fund also follows the same index that MUB tracks. So it goes without saying that the proposed fund will face tough competition from the largest ETF in the space, i.e. iShares’ MUB. While the lack of first-movers advantage will be a negative for Vanguard, its ability to roll out a product on an ultra low price should give it an edge over many others presently on offer. Going by fundamentals, intermediate term munis offer great opportunities right now especially with the improving fiscal health of the U.S. states and a plunge in intermediate-to-long term yields. The only bump in the road ahead for Vanguard is its late entry to this space. It’s hard to predict how Vanguard’s new product would perform, but a low expense ratio should be the key to a sizable asset base or greater market share than iShares’ ultra-popular product.