Tag Archives: open-xhr-start

Active Vs. Passive Investing: The Real Scoop

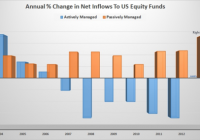
As of October 31st, investors had plowed over 60 billion into passive index funds this year while yanking over 80 billion away from actively managed funds. Statistics, on their face, can mislead us quicker than they can enlighten. Of all the US Large Cap Equity funds that had both high ownership and low cost, over 75% of them outpaced the indexes on a 5 year rolling return and. Like fitness bands and frappuccinos, index funds are high fashion. As of October 31st, investors had plowed over 60 billion into passive index funds this year while yanking over 80 billion away from actively managed funds. And why not? It’s well known most active managers do not outpace their benchmarks. Index funds are cheap, simple, and the upkeep is nominal. Indeed, more than ever, the joes, and pros, are turning to index based investing. On the other hand, we cannot deny the fact that investors feverishly jump into trends at precisely the wrong time. So, are index fund investors truly onto something or are they somehow being misguided? First, and for a quick refresher; index funds are investment vehicles that provide a way to closely mimic the returns of a specific index – such as the S&P 500. There are hundreds of indexes and over a thousand index funds. Each index is designed to track an area of a certain market and is formed by its own set of specific criteria. Since the criteria is based on objective data, there’s no need for an index fund to pay big money or bonuses to an investment manager as they need only copy their corresponding index. Consequently, the management of an index fund is largely administrative; hence, the low expense ratios and portfolio turnover. (Note: The data and observations provided are not exhaustive. All references herein are in regards to equity based funds only. ) Much of the frenzy over index funds has come from academic research showing that actively managed funds do not typically beat their respective index. For example, in a recent study by Standard & Poors, less than 30% of active fund managers outperformed their indexes in any given year between March 2009 and March 2014. Of the managers who did outperform the market, only a few did so with any significant edge. Of greater “consequence” to investors, over the 5 year period, less than 1% of the managers were able to return to the top quartile of funds for 5 consecutive years. What this means is that in that period of time, if you had simply invested in an S&P 500 index fund, which required no active portfolio management, you would have earned a better return than more than half of the portfolio managers. And this is just a small example, as there are many studies out there that point to the same thing – cheap, simple, index funds put the odds in your favor. Active managers rarely consistently beat the indexes therefore their typical 1.5% annual fee cannot be justified. So, considering the overwhelming evidence against active managers, it would be downright foolish not to join in with the index fund movement…..right? Well, not so fast. “There are lies, damned lies, and statistics.” – Mark Twain Statistics, on their face, can mislead us quicker than they can enlighten. Notwithstanding the reality that most active managers do in fact drift under the indexes, we must push onward, and look deeper into what information is being shown, or not. First, we need to acknowledge that these numbers do not include separate and private wealth managers. So, right off the bat we’re missing some of the very best in the business. (Ahem) That aside, what about the managers who do in fact consistently outpace their indexes? Are they just a lucky few? Maybe. But what if we could find a common characteristic, or positive correlation between them? Perhaps that would grab the attention of even the most dogmatic of index investors. Morningstar’s 2014 US Mutual Fund Stewardship Survey shows and highlights precisely these types of correlations. In the study, they discover two notable common characteristics between the top ranking active managers: High Manager Ownership – This firms where 80% of the assets managed have at least 1 manager owning 1 million dollars or more of the shares. Low Expenses – This is firms charging 1% or less. The report shows managers with these two characteristics exhibit very high levels of success. How high? Capital Group, a division of the behemoth American funds, took this research and dug even deeper to find some very powerful information. Their research piece, The Active Advantage , sifts through Morningstar’s research and highlights many interesting tidbits. One item they found stands out quite powerfully all alone: Of all the US Large Cap Equity funds that had both high ownership and low cost, over 75% of them outpaced the indexes on a 5 year rolling return and 100% of them beat the indexes on a 10 year rolling return. Therefore, by simply screening for funds with reasonable expenses and good ownership, we can completely reverse the aforementioned stats against active managers. While the oft maligned world of active management does have some merit, it seems unwise to forever close one’s mind to a concept that works incredibly well for so many. We simply need to find a better way to measure the quality of an active manager. Expenses, firm structure, and manager incentive is a start. The truth is, much of investing is about getting yourself, and your portfolio, on firm ground. Don’t make beating the market your only goal. Try to put the odds in your favor by focusing on things you can control such as expenses, taxes, portfolio cash flow, and of course proper incentive if you have an investment advisor or manager. Finally, it’s old hat, but I must say that chasing market returns, whether passively or actively, isn’t usually a good idea. Pouncing on the highest number as of late, is exactly that – late. Yet, oddly enough that is precisely how the industry works. Investors want to see good past performance, and many advisors screen and sell off off these high numbers. Active managers are continually being threatened by the rise of index funds so they’ve become even further pressured to outpace the indexes. That is, until the indexes turn around and head in the other direction. Unquestionably, much of this is a circular problem – with the average investor stuck in the loop.
How Do Fidelity’s New Bond Exchange-Traded Funds Stack Up?

A version of this article was published in the November 2014 issue of Morningstar ETFInvesto r. Download a complimentary copy of ETFInvestor here . On Oct. 9, Fidelity launched three active-bond exchange-traded funds: Fidelity Total Bond (NYSEARCA: FBND ) , Fidelity Corporate Bond (NYSEARCA: FCOR ) , and Fidelity Limited Term Bond (NYSEARCA: FLTB ) . The table below shows the lead managers of each fund as well as their mutual fund analogs. All six funds charge 0.45%. Fidelity follows PIMCO in launching active-bond ETFs, inviting comparison between the two. Are these new funds better than existing PIMCO ETFs? Or passive funds? Fidelity Versus PIMCO Fidelity is more known for its equity funds, but Morningstar analyst Sarah Bush writes that its bond team is “among the industry’s best.” PIMCO is synonymous with fixed income, and analyst Eric Jacobson writes that the firm “[boasts] world-class practitioners and intellects across the board.” So investors have two good options. One big difference between the firms is that PIMCO makes big macroeconomic calls, whereas Fidelity’s bond funds won’t. Most Fidelity bond funds keep their durations close to their benchmarks and focus on making security- and sector-level credit bets. As a consequence, some of Fidelity’s bond funds failed to sidestep the subprime crisis and the financial crisis and suffered sharp losses relative to their benchmarks. PIMCO’s funds, however, sailed through relatively unscathed, having avoided subprime exposure. On the other hand, PIMCO suffered sharp losses in 2011 when it incorrectly bet against Treasuries; Fidelity’s bond funds made no such dramatic calls. Historically, PIMCO’s extensive use of factor timing meant that its fund’s patterns of excess returns relative to their benchmarks were less predictable than Fidelity’s bond funds, which tend to do well when credit does well. Fidelity Total Bond Ford O’Neil is lead manager of both FBND and its mutual fund counterpart, Fidelity Total Bond (MUTF: FTBFX ) . Naturally, the ETF itself can’t be assessed with confidence, but we can make reasonable inferences about its prospective behavior by looking at the mutual fund version of the strategy. O’Neil has spent almost 10 years running the mutual fund, so we have a lot of data to work with. Here’s how Bush describes Fidelity Total Bond’s process: This wide-ranging fund has a variety of tools at its disposal. As at other Fidelity bond funds, duration (a measure of interest-rate sensitivity) is kept close to that of the fund’s bogy, the Barclays U.S. Aggregate Bond Index. Instead, manager O’Neil seeks to beat this benchmark over a three-year period by identifying relatively underpriced sectors of the market and segments of the yield curve, and through individual security selection. This is primarily an investment-grade portfolio–think high-quality corporate bonds, agency mortgages, and Treasuries–livened up with a mix of junk bonds, floating-rate bank loans, and developed- and emerging-markets debt. The fund gets its bank-loan and mortgage exposure from internally run Fidelity “central” funds run by other managers; bank loans are relatively illiquid, so the central-fund approach helps control cash flows, while O’Neil argues that there are significant advantages of scale in the mortgage portfolios. Since O’Neil took over, the fund beat its benchmark by 0.48% annualized as of Sept. 30, 2014. Of course, you can’t own the index. When compared against Vanguard Total Bond Market Index (MUTF: VBMFX ) , O’Neil looks a bit better, extending his edge to 0.61% annualized. However, we care about returns in excess of risk taken. The next chart shows Fidelity Total Bond’s cumulative wealth ratio versus Vanguard Total Bond Market Index. When the line slopes up, Fidelity’s fund is outperforming the Vanguard fund; when it slopes down, it’s underperforming. Total Bond did outperform over O’Neil’s tenure, but at the cost of a nasty drawdown that showed up during the financial crisis. We can get a fuller picture of O’Neil’s record by examining his tenure at Fidelity Intermediate Bond (MUTF: FTHRX ) , which covered July 13, 1998, to Oct. 29, 2013. It is the oldest and longest U.S. bond fund track record of his that we have. The second chart shows cumulative wealth of the fund against its benchmark, the Barclays Intermediate U.S. Government/Credit Index. We see benchmark-matching performance punctuated by a nasty drawdown during the financial crisis. What accounted for these drawdowns? First, O’Neil kept a slug of his fund in an internally managed ultrashort bond portfolio that had substantial exposure to subprime mortgages, which led to the fund’s lagging in late 2007. Second, the fund also had a junk-bond sleeve going into the crisis, but the index excludes them. Despite O’Neil’s mixed record versus his benchmarks, Fidelity Total Bond outpaced most of his category peers, landing in the top 22% for the 10 years ended Sept. 30. The Fidelity Total Bond mutual fund has a Morningstar Analyst Rating of Gold, which indicates Morningstar believes the fund will beat its category peers on a risk-adjusted basis over a full market cycle. There is only one other actively managed ETF of note benchmarked against the Aggregate Index: PIMCO Total Return Active (NYSEARCA: BOND ) , which serves as my default broad bond exposure. The only sensible way to assess investments is through the lens of opportunity cost. Am I giving up space that could be devoted to a better fund if I stick with BOND? I’m about as confident as can be that BOND can beat its benchmark over a full interest-rate or credit cycle, without taking on much more risk. The next chart shows PIMCO Total Return’s cumulative wealth ratio versus the benchmark juxtaposed with Fidelity Total Bond’s cumulative wealth ratio. The different performance patterns reveal the distinct processes driving each fund. PIMCO Total Return is willing to make big macro calls–market-time, in other words–hence its sidestepping much of the carnage of the financial crisis, riding the mortgage-backed securities wave, then getting clobbered in 2011 on its big short Treasury bet. Fidelity Total Bond mostly makes security- and sector-level calls without varying its duration or taking too much risk off the table. The result is the fund that took a beating during the crisis but has steadily earned excess returns as credit exposure has done well. Fidelity Corporate Bond Michael Plage and David Prothro comanage this fund. Although Plage is lead manager of FCOR, Prothro is lead of the mutual fund Fidelity Corporate Bond (MUTF: FCBFX ) . Neither Plage nor Prothro have O’Neil’s long track record. Plage joined Fidelity in 2005 as a fixed-income trader before switching to a portfolio-management role in 2010. Prothro has been with Fidelity as a fixed-income analyst since 1991, but his oldest pure U.S. bond mandate also begins in 2010. Plage and Prothro have done very well with Fidelity Corporate Bond. They’ve beaten their benchmark, the Barclays U.S. Credit Index, by more than 1%. So far it seems as if Plage and Prothro have what it takes. But we haven’t gone through a full credit cycle, so I’m not willing to assign a high degree of confidence that their fund will outperform. There is no other actively managed bond ETF also benchmarked to a similar index or in the corporate-bond category. Fidelity Limited Term Bond FLTB, led by Robert Galusza, begs natural comparisons with the mutual fund Fidelity Limited Term Bond (MUTF: FJRLX ) , also managed by Galusza. The mutual fund’s track record is utterly misleading. A closer look reveals that Fidelity Limited Term Bond until very recently was the Fidelity Advisor Intermediate Bond Fund, which was benchmarked to the Barclays U.S. Intermediate Government/Credit Bond Index. Its lead manager was also O’Neil, who began managing the fund the same day he took over Fidelity Total Bond and ended his tenure on Oct. 29, 2013. Now we have another angle to assess Fidelity Total Bond. Unfortunately, during O’Neil’s tenure, Fidelity Advisor Intermediate Bond underperformed its benchmark with much more volatility. A more relevant mutual fund equivalent for Fidelity Limited Term Bond is Fidelity Short-Term Bond (MUTF: FSBFX ) , which Galusza joined on July 12, 2007. However, Andrew Dudley managed the fund until Feb. 21, 2008. In order to give Galusza the benefit the doubt, I’ll assess his performance the month after Dudley left. The chart shows how he did against the fund’s benchmark, the Barclays U.S. 1-3 Year Government/Credit Bond Index. Like Fidelity Total Bond, Fidelity Short-Term Bond took a big hit during the financial crisis due to its subprime mortgage exposure. Of all three funds, this one is the least appealing from a historical risk/return perspective. It’s also going up against extremely stiff competition in the form of high-yield, low early withdrawal penalty five-year bank CDs that offer 2% yields as of this writing. No ETF offers anywhere near as favorable a risk/reward trade-off. I’ve been consistent in pointing out that low-duration funds are a bad deal, including the two other active ETFs benchmarked to the Barclays U.S. 1-3 Year Government/Credit Bond Index: AdvisorShares Newfleet Multi-Sector Income (NYSEARCA: MINC ) and PIMCO Low Duration Active (NYSEARCA: LDUR ) .

Preserve Purchasing Power With This ETF

By Thomas Boccellari Unexpected inflation can be corrosive to a fixed-income portfolio. While bond investors have had to contend with punishingly low interest rates, they have gotten a reprieve on the inflation front. In large part because of falling energy prices, inflation was only 1.3% over the trailing 12 months through November 2014. Because energy is a key input into nearly every aspect of the U.S. economy, it has a big impact on the total cost of production from everything from food and clothing to housing and transportation. Over the trailing 20 years through November 2014, the correlation between WTI Crude and the Consumer Price Index was 0.93. The strength of the U.S. dollar has also been a major contributor to low inflation. Because the eurozone and Japan have weakened their currencies to spur growth in their local markets, the U.S. dollar has strengthened against these currencies. This allows U.S. consumers cheaper access to imported goods from these markets. This is especially important as wage growth remains relatively low in the United States. Because of these trends, expected inflation is low. As of Jan. 12, 2015, the 10-year Treasury’s yield was 1.92%, while the yield of the 10-year TIPS was 0.35%. This implies a break-even inflation rate of 1.57%. The break-even inflation rate is the level inflation would have to increase above before investors would earn higher real returns in Treasury Inflation-Protected Securities. Over the trailing 20 years through November 2014, the average break-even inflation rate was 2.2%. Investors who believe that the long-term inflation will exceed the low-inflation expectations currently priced into traditional bonds may consider a TIPS exchange-traded fund such as Schwab US TIPS ETF (NYSEARCA: SCHP ) –the lowest-cost TIPS ETF available. This fund tracks a broad, market-cap-weighted portfolio of TIPS with more than a year left until maturity. Because TIPS are excluded from aggregate bond ETFs, this fund can be used as a complementary core holding for investors who own an aggregate bond market ETF such as Schwab U.S. Aggregate Bond ETF (NYSEARCA: SCHZ ) (0.06% expense ratio). Because more than half of the fund’s assets were invested in TIPS with maturities greater than seven years, at the end of December 2014, it had a longer duration (7.7 years) than the non-inflation-protected Barclays U.S. Treasury Bond Index (5.7 years). Duration is a measure of interest-rate sensitivity. Therefore, if interest rates were to increase 1%, investors could expect the fund and the Barclays U.S. Treasury Bond Index to decline by 7.7% and 5.7%, respectively. Generally, TIPS’ inflation adjustment is paid at maturity but taxed annually. To make tax time easier, the fund distributes inflation adjustments to the principal in addition to the coupon payment on a monthly basis. However, the fund may suspend interest payments during periods of deflation. This is because the inflation adjustment will become negative and will be offset against the coupon payments. Fundamental View TIPS combine the security of Treasuries with inflation protection in the form of Consumer Price Index-adjusted principal. The CPI represents the cost of a broad basket of goods and services. Inflation will drive the price of that basket higher, and deflation will make it cheaper. When the CPI goes up, a TIPS’ principal is adjusted upward accordingly. Even though the interest rate on the bond remains the same, the semiannual coupon is paid based on the adjusted principal. Inflation may still not rise substantially enough for TIPS to make sense. If interest rates remain consistent or rise slowly, the fund will likely underperform comparable non-inflation-protected bonds. For example, over the trailing six months through November 2014, U.S. inflation fell to 1.3% from 2.1%. Over this time period, the fund’s return (negative 0.7%) was less than that of the Barclays U.S. Treasury 7-10 Year Index (3.1%). However, if the inflation rate increases rapidly, the fund is likely to outperform the Barclays U.S. Treasury 7-10 Year Index. When the inflation rate increased to 2.1% in June 2014 from 0.9% in October 2013, the fund’s return (3.6%) exceeded that of the index (3.1%). The fund’s long duration (7.7 years) may also negate its inflation-protection benefit. This is because long maturity bonds are more susceptible to changing interest rates, which tend to rise when inflation increases. This is because the Federal Reserve often raises rates in order to curb inflation. If long-term interest rates increase with inflation, it could hurt the fund’s returns. For example, from July 2012 through July 2013, the 10-year Treasury yield increased to 2.6% from 1.5%. Over the same period, inflation increased to 2.0% from 1.4%. Despite the increase in inflation, the fund’s return (negative 4.2%) was less than that of the Barclays U.S. Treasury 7-10 Year Index (negative 3.7%) because of the fund’s longer duration. However, long-term interest rates have historically been less volatile than short-term rates. However, Federal Reserve action generally has a larger impact on short- and intermediate-term yields and less on long-term yields. This is because the Fed relies primarily on open market operations to influence short-term interest rates. If the Fed increases short-term interest rates to curb inflation and long-term rates remain relatively stable, the fund may not experience a significant loss. Portfolio Construction The fund tracks the Barclays U.S. Treasury Inflation Protected Securities (TIPS) Index (Series-L), which includes all TIPS issued that have at least one year left until maturity and $250 million in par value. The index is market-cap-weighted and rebalanced monthly. While TIPS are less liquid than Treasuries, the fund’s full index replication strategy has helped to minimize its index tracking error. Fees The fund charges 0.07% annually and is currently the cheapest TIPS ETF. Over the trailing three years through December 2014, the fund has lagged its benchmark by 0.09%, slightly greater than the amount of its expense ratio. Alternatives The largest and most liquid TIPS ETF is iShares TIPS Bond (NYSEARCA: TIP ) (0.20% expense ratio). It tracks the same index as SCHP. SPDR Barclays TIPS ETF (NYSEARCA: IPE ) (0.1865% expense ratio) tracks the Barclays U.S. Government Inflation-Linked Bond Index. While similar to the index that SCHP and TIP track, IPE requires that TIPSs have a minimum $500 million outstanding. As of December 2014, IPE had a shorter duration (6.1 years) and lower yield (1.8%) than SCHP and TIP. Shorter-duration TIPS indexes are somewhat more correlated to inflation, given their lower interest-rate sensitivity. Vanguard Short-Term Inflation-Protected Securities ETF (NASDAQ: VTIP ) (0.10% expense ratio) tracks an index that targets TIPS with maturities of less than five years. As a result, its duration (1.4 years) is considerably lower than SCHP’s. However, it also has a lower yield (0.9%). Another option is PIMCO 1-5 Year U.S. TIPS ETF (NYSEARCA: STPZ ) (0.20% expense ratio), which tracks a similar index as VTIP. Actively managed PIMCO Real Return (MUTF: PRTNX ) (0.85% expense ratio for A share class) has a Morningstar Analyst Rating of Silver. This fund follows a benchmark of TIPS and inflation-linked bonds but tries to garner additional returns through active bets. Disclosure: Morningstar, Inc. licenses its indexes to institutions for a variety of reasons, including the creation of investment products and the benchmarking of existing products. When licensing indexes for the creation or benchmarking of investment products, Morningstar receives fees that are mainly based on fund assets under management. As of Sept. 30, 2012, AlphaPro Management, BlackRock Asset Management, First Asset, First Trust, Invesco, Merrill Lynch, Northern Trust, Nuveen, and Van Eck license one or more Morningstar indexes for this purpose. These investment products are not sponsored, issued, marketed, or sold by Morningstar. Morningstar does not make any representation regarding the advisability of investing in any investment product based on or benchmarked against a Morningstar index.