Tag Archives: open-xhr-start

How To Build A ‘Lifetime’ Portfolio, Step 2 Of 2

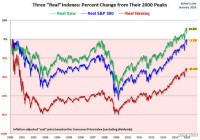
In step 1, we focused on asset classes and how asset allocation can make us better investors. Now we take a look at how these asset classes are correlated to each other (or not!). And we offer for your due diligence the ETFs and funds we believe are superior to the “usual suspects’. The Asset Allocation chart we showed in Step 1 of this series ( here ) engendered considerable valuable discussion in the comments section of that article. While I addressed all issues raised in that area, I want to say here, as well, that when I transferred the chart from our monthly investment publication, the text box crediting the source of that chart did not come through on what I submitted to SA. Mea culpa! I take others’ hard work as seriously as I do my own and appreciate their willingness to share the results of their research. That chart came from Novel Investor ( novelinvestor.com .) If you’d like to see the full-year ended 2014, that is now posted there as well. Until the Swiss Swooping Swan (we can’t really call it a Black Swan; it was wholly unexpected given the Swiss central bank’s protestations of just 48 hours prior, but it is not a cataclysmic event for US investors) the prevalent investing mantras went something like this: ^ “Be long the dollar, short the euro. There is no stopping the juggernaut that is the US dollar. Where else can you go?” ^ “Europe, China, Australia, Asia, et al are struggling. There’s no upside there.” ^ “Interest rates must rise now since the Fed must control inevitable inflation.” ^ “Emerging markets are dead, or at least in an extended coma.” ^ “Utilities, bonds and REITs must fall this year as rates rise.” ^ “Commodities are dead. Copper, iron, cotton, oil, gas, you name it – if it is subject to supply and demand, it is dead.” As further evidence that an Asset Allocation model protects you from market risk more effectively than simply buying a benchmark index fund, I believe that every one of those assumptions are now called into question as the Swiss, the Danes, and others have now tried to protect themselves from the inevitable and finally announced QE from the European Central Bank (working with and through the various national central banks, of course.) The point is that we never know when there will be a shot out of the blue that upsets our most treasured assumptions and calls into question our investing direction. Owning different asset classes reduces that risk considerably. With market history on our side, we will continue to allocate assets in a diverse manner, placing some funds into the areas that offer the most compelling valuations no matter what the CNBC talking-their-book talking heads expect. For instance, we don’t buy or sell something called “the EC.” We buy great European companies / multinationals that will continue to be great European companies / multinationals. We have tried to position our family and client portfolios for what we believe will be the sweet spot of this aging bull market, but we still diversify “just in case.” I believe the confluence of low rates, low inflation, institutions with money to spend, the typical small stock bias for the first two quarters, and the third year of the presidential election cycle will make for a most wonderful time of the year and possible a timely denouement for the bull, with the final year (if it proves to be) typically the one with the greatest volatility and the greatest overall returns. For those who believe the bull is too old and too tired to continue, I provide the chart below from Doug Short ( dshort.com ) which shows that, allowing for inflation, the “real” returns on the S&P 500 and the Nasdaq haven’t even yet returned to the highs they reached back in the year 2000. That’s why we view any pullback in January, like last year’s January decline, to be an opportunity to reallocate to our most favored sectors. Talking “Big Picture” Before I discuss some specific mutual funds, closed-ends and ETFs that our research has led us to consider in our asset allocation portfolios, I think it’s important to illustrate one other tool we use to ensure that we have appropriate diversification among asset classes. Some investors believe they are “diversified” because they split portfolio assets between Large Cap Growth, Blend and Value, Mid Cap Growth, Blend and Value, and Small Cap Growth, Blend and Value. There! 9 categories; that’s diversified! Except that it isn’t. These categories are all positively correlated. When the Dow is up, most often the S&P, the Nasdaq and the Russell are all up. Sadly, the opposite is also true. When one goes down, they all go down. That’s why most “diversified” portfolios were decimated in the 2008-2009 decline. It’s also why our portfolios lost only half as much. Are you willing to give up bragging rights at a cocktail party in order to see your portfolio increase more steadily? Willing to accept that you won’t “beat the market” (or at least one of its benchmarks) every year? Then you are ahead of the pack – way ahead. The relationship between various investments illustrated below makes all the difference between a few good years followed by a few disastrous years followed by a few good years followed by… well, you get the idea. If you truly want to get off that roller-coaster, you must pay attention to the long-term correlations among various asset classes. (click to enlarge) These correlations change over time, of course, and each year will likely be slightly different than the previous and the next. It’s the Big Picture that counts. That’s why I have selected an historical chart, this one from the website doughroller.com in an article by Rob Berger, “Are Correlation Coefficents Converging Among Previously Disparate Asset Classes?” wherein the author cites work by William J. Coaker II covering the 25 years from 1970-2004. To my point above, please note how tightly correlated, large growth, large value, mid growth, mid blend and mid value are correlated: the lowest value obtained was a 73% correlation between mid-cap growth and mid-cap value. On the other hand, adding an asset like real estate ETFs had only a 52% correlation with the S&P 500, global bonds a negative 0.3% and a long/short fund a negative 0.1%. This does not mean that if the S&P 500 is up 10% in a given year, that real estate would only be up 5.2%. Indeed it might mean real estate outperforms the S&P 500. The correlations between asset classes simply imply independence from each other. They are not a predictor of performance! We don’t care what the markets do on any given day. But if we discern the need to lighten up on our long exposure to large caps like the S&P 500, we would increase our holdings of asset classes poorly correlated with large caps, like global bonds, long/short Funds, and natural resources. If we just aren’t sure but our indicators tell us something is beginning to go amiss, we will typically at least move into more REITs and international stocks. What Might You Want to Consider Owning? Our research and analysis leads us to conclude that what follow are some of the best proxies for the asset classes we choose to diversify with. Your mileage may vary. Be sure to conduct your own due diligence and decide what works best for you. For us… US Large Caps are typically covered in most asset allocation portfolios by the SPDR S&P 500 ETF (SPY.) We are willing to seek niches within the asset class that may be more biased to equal weighting or more aggressive during times of market recovery, etc. For that reason our universe is considerably larger than SPY and includes ETFs like Schwab US Large-Cap Growth (SCHG,) iShares S&P 500 Growth (IVW,) Vanguard S&P 500 Growth (VOOG,) and Guggenheim S&P 500 Equal Weight. For a blend of US large cap growth and value, we’ll consider, among others, PowerShares S&P 500 High Quality (SPHQ,) Vanguard Russell 1000 (VONE,) and iShares Morningstar Large-Cap (JKD.) If we’re looking more on the value end of this spectrum, a couple we like are Wisdom Tree Dividend ex-Financials (NYSEARCA: DTN ) and PowerShares Dynamic Large Cap Value (PWV.) Among funds, we also use Smead Value Investor (SMVLX.) In the US Small / Mid Cap growth arena, we might prefer to look at iShares S&P Small-Cap 600 Growth (NYSEARCA: IJT ) or two of our favorite mutual funds, Aston/LMCG Small Cap Growth (MUTF: ACWDX ) or Akre Focus Retail (AKREX.) Among small cap blends, we like Guggenheim Spin-Off (CSD,) Schwab US Small-Cap (SCHA,) and mutuals Hodges Small Cap (MUTF: HDPSX ) and Mairs & Wasatch Strategic Income (WASIX.) For pure value, we lean toward WisdomTree SmallCap Dividend (NYSEARCA: DES ) and WisdomTree MidCap Dividend (DON.) In Real Estate, we like our choices of Schwab US REIT (NYSEARCA: SCHH ) and IQ US Real Estate Small Cap (NYSEARCA: ROOF ) more than the more-frequently selected Vanguard REIT (NYSEARCA: VNQ ) and SPDR Dow Jones REIT (RWR.) And we particularly like one fund, Baron Real Estate (BREFX.) Among International Large Cap alternatives, our favorites are all mutual funds: Artisan Global Equity (ARTHX,) Deutsche Global Infrastructure (TOLLX,) and Leuthold Global Industries (MUTF: LGINX ) are among our holdings. We also own some Deutsche X-trackers MSCI EAFE Hedged Equity (NYSEARCA: DBEF ) and WisdomTree Europe Hedged Equity ETF (HEDJ.) For International Small Caps, WisdomTree Europe Hedged Equity (NYSEARCA: DFE ) percolates to the top, with Tweedy Browne Global Value (MUTF: TBGVX ) a consistent top performer. Emerging Markets offers a plethora of ETFs. We prefer Schwab Emerging Markets Equity (NYSEARCA: SCHE ) to the better-known EEM and VWO, and would prefer funds like Driehaus Emerging Markets Small Cap (MUTF: DRESX ) and HSBC Frontier Markets (MUTF: HSFAX ) for the more difficult to research Emerging Markets small caps. We also sometimes rotate into our mix some sectors we believe might be better than straight capitalization-based asset class selection, a few long/short ETFs and mutual funds, US and foreign bonds and, for clients who will benefit most by them, municipal bonds and closed-end bond funds. At this point, our total bond allocation is smaller than normal. Why do we typically carry some of these positions even during the best of times for the S&P 500? Because slow and steady wins the race. I can think of no better way to end this discussion of our way of investing than with the timeless wisdom of Ecclesiastes 9:11… “The race is not to the swift or the battle to the strong, nor does food come to the wise or wealth to the brilliant or favor to the learned; but time and chance happen to them all.” As Registered Investment Advisors, we believe it is our responsibility to advise that we do not know your personal financial situation, so the information contained in this communiqué represents the opinions of the staff of Stanford Wealth Management, and should not be construed as personalized investment advice. Past performance is no guarantee of future results, rather an obvious statement but clearly too often unheeded judging by the number of investors who buy the current #1 mutual fund one year only to watch it plummet the following year. We encourage you to do your own due diligence on issues we discuss to see if they might be of value in your own investing. We take our responsibility to offer intelligent commentary seriously, but it should not be assumed that investing in any securities we are investing in will always be profitable. We do our best to get it right, and we “eat our own cooking,” but we could be wrong, hence our full disclosure as to whether we own or are buying the investments we write about.
The Rise Of Factor Investing And The Implications For Asset Allocation

Once upon a time there was only one factor-the market, a la the capital asset pricing model. But after a half century of crunching the numbers since CAPM was born, “now we have a zoo of new factors,” as Professor John Cochrane observed a few years ago. In theory, identifying more factors opens the door for building superior risk-adjusted portfolios. But some practitioners worry that “the proliferation of factors is deeply troubling,” as Research Affiliates explained recently. Why? Because not all factors are created equal and securitizing what looks like a productive risk premium on paper is tricky when it comes to real-world results. Finding success in the factor zoo, in other words, is quite a bit more challenging than it appears when reading finance journals. But for those who are willing to try, there are numerous ETFs and mutual funds to choose from in the new world order. Taking the marketing material at face value tells us that clever strategists can build smart-beta portfolios that leave their standard-beta counterparts in the dust. That’s certainly possible, but the pernicious rumor promoted by some folks that happy outcomes are inevitable is misleading at best. The main problem is that quite a lot of what some see as compelling evidence in favor of going off the deep end with smart beta funds is really just cherry-picking the strongest performers. You can certainly find ETFs and mutual funds that deliver encouraging results in the art/science of mining smart beta. But there are plenty of dogs as well. The real question is whether there’s any evidence that, all else equal, an asset allocation strategy populated with smart-beta funds reliably outperforms its conventional-beta counterparts in a convincing degree on a risk-adjusted basis? Coming up with an answer is tougher than it sounds, in part because there aren’t a lot of smart-beta ETFs and mutual funds with sufficiently long records to run a robust test. The original factor strategies-i.e., small-cap and value-have been around for a few decades and so there’s a relatively deep and wide empirical record to study on this front. And the results are encouraging, particularly when it comes to value. But there’s a bigger mystery with the newer generation of factor funds that target an array of risk premiums, such as momentum, quality, and volatility. And more are on the way. Some of this is little more than data mining. Looking for relatively strong relationships in the cross section of security returns is child’s play at this point, thanks to the rise of inexpensive computing power. But the transition from encouraging in-sample results to out-of-sample confirmations using real-world funds is a slippery affair. Most of the studies to date focus on a single asset class; kicking the tires when it comes to asset allocation is still in its infancy with regards to smart beta analysis. As a preliminary test, I recently ran a test using a set of smart-beta funds that track indexes designed by one of the more respected names in the business. The analysis is compelling because the smart-beta funds I review have been around for at least five years and hug benchmarks designed by a single firm. Meanwhile, there are low-cost alternatives that track conventional cap-weighted indexes. In short, we have the ingredients for a robust test of real-world results. It’s hardly definitive, but it offers some perspective on how smart beta fares in asset allocation. I created two sets of equity portfolios-a smart-beta strategy and its standard-beta counterpart for a U.S./foreign equity allocation using five allocation buckets (U.S. broad, U.S. small cap, U.S. value, foreign developed, foreign Asia ex-Japan). The initial portfolio weights are identical. I ran the numbers with a year-end rebalancing strategy vs. a buy-and-hold portfolio. In both cases the results are the virtually the same, namely: there’s not a lot of difference between smart-beta and conventional-beta portfolios over the past five-year period. In a future post, I’ll lay out the details with a review of the numbers, at which point I’ll name names. For now, let’s just say that the data suggests that building portfolios with smart-beta funds may not be a silver-bullet solution that reliably outperforms a comparable strategy using conventional index funds. Why? Several reasons. First, smart-beta funds have higher expense ratios, although for the test I ran the funds under scrutiny charged only moderately higher fees vs. the traditional index funds. Another challenge is the simple fact that smart beta doesn’t always outperform, at least not reliably so across all asset classes at all times. This is a major challenge for analysis in this corner because there’s a growing number of vendors using a wide set of criteria for designing funds. Ideally, investors will select only those products that will deliver superior results and otherwise use standard index funds. But this is harder than it sounds, particularly for time horizons over, say, one to three years. In my test, some of the smart-beta funds outperformed (some of the time), but others stumbled. The result: the wins cancelled out the gains and the overall results tracked the portfolios built with conventional index funds. Selecting one or two smart-beta funds and earning superior results over standard index products is one thing, but it’s a tougher game when applied to a broad asset allocation strategy over a longer-term horizon. Some of this is due to the variation in the design quality of products, but there’s also lots of debate about what’s likely to work in the smart-beta zoo vs. what’s an anomaly that won’t survive beyond the realm of backtesting. As a recent paper (“Facts and Fantasies About Factor Investing”) by researchers at Lyxor Asset Management explains: From a professional point of view, only a few number of risk factors and anomalies are reliable. Among these relevant factors, we find for example [small-cap, value and momentum]. But, even with a reduced set of less than 10 factors, there are again a lot of questions to answer in order to understand what the nature, the behavior and the risk of these factors are. Academics have done extensive studies on these questions and their work can help to find the answers, but some questions still remain open, in particular the level of the risk premia. That last point, about the level of risk premia, is critical. Indeed, after adjusting for commissions, taxes and various real-world frictions, there’s a high bar for arguing that a given factor is a viable candidate for use in real-world portfolios. The bottom line is that the evolution from conventional-beta products to smart-beta funds comes with a number of hazards. By contrast, the transition from conventional active management to plain-vanilla indexing over the past generation has been and remains a more reliable process, particularly in the context of designing and managing multi-asset class portfolios. That doesn’t mean that smart beta isn’t a productive development in assert pricing and money management. But it turns out that there’s a lot more art than science in the next generation of indexing than some folks would have you believe. As a result, beating Mr. Market’s asset allocation over the long run will likely remain as challenging as ever.

State Of Disunion: Safer Haven Investments Diverge From Stocks

The appetite for risk has been changing before our eyes. Large-cap U.S. stocks in the S&P 500 still rocketed mightily. Safer haven assets were every bit as desirable as the Dow and the S&P 500 in 2014. Is that uncommon for a late-stage bull market? Not particularly. On the other hand, the landscape may be changing. The S&P 500 soared 29.6% and 11.4% in 2013 and 2014 respectively, pushing the broad market benchmark to unimaginable heights. Net inflows into U.S. stock funds, including ETFs, also set records. Unfortunately, that is not always a positive sign for the asset class. The increased participation by the world’s investors in U.S. stocks may not be inordinately alarming. What might be far more ominous? The remarkable performance of safer haven assets over “stuck-in-place” stock assets since the Federal Reserve ended its third round of quantitative easing (QE3) on October 31. Specifically, the 30-year treasury yield has plummeted from roughly 3.0% to 2.4%, sending a proxy like the PIMCO 25+ Year Zero Coupon U.S. Treasury Index ETF (NYSEARCA: ZROZ ) up more than 20%. Similarly, the iShares 20+ Year Treasury Bond ETF (NYSEARCA: TLT ) has pocketed nearly 14%, while the SPDR Gold Trust ETF (NYSEARCA: GLD ) has rallied about 10%. The appetite for risk has been changing before our eyes. Remember the success of riskier equities in 2013, as investors ran from treasury bonds and gold? Indeed, 2013 was only one of two negative years for total bond returns across two decades. Equally staggering, gold appeared to many as if it might collapse altogether. The nature of risk shifted in 2014. Large-cap U.S. stocks in the S&P 500 still rocketed mightily. Yet the clear preference of stocks over safer holdings evaporated; treasuries rallied throughout the year, in spite of the near-unanimous sentiment that interest rates would fall. (Note: I am not opposed to tooting my own horn on this one – I recommended pairing large-cap stock ETFs with long duration treasury ETFs like the Vanguard Extended Duration Treasury ETF (NYSEARCA: EDV ) and ZROZ 13 months earlier.) Safer haven assets were every bit as desirable as the Dow and the S&P 500 in 2014. Some of them like TLT and ZROZ were more desirable. At least for a calendar round-trip, the ownership of historically divergent asset classes produced harmony and indivisibility. Is that uncommon for a late-stage bull market? Not particularly. On the other hand, the landscape may be changing. The perceived need for safety has risen appreciably since the Federal Reserve ended its electronic money printing in October. For example, in 2015, each of the 10 components of the FTSE Custom Multi-Asset Stock Hedge Index has gained ground, whereas the S&P 500 has drifted lower. Those component assets include long-maturity treasuries, zero-coupon bonds, munis, inflation-protected securities, German bunds, Japanese government bonds, gold, the Swiss franc, the yen and the dollar. Granted, the European Central Bank (ECB) intention to create $50 billion euros monthly for a year could reward risk-taking in the same manner that the Federal Reserve’s $85 billion per month had. On the flip side, the $600 billion euro figure that is floating on newswires may come off as underwhelming, as the Fed’s QE3 had been open-ended upon its announcement. Moreover, the “stimulus” amount ran beyond the trillion-and-a-half level. Keep in mind, you do not need to run from stock risk if you have a plan to minimize the severe capital depreciation associated with bear markets. My approach in latter stage bull markets involves pairing lower volatility stock ETFs like the iShares MSCI USA Minimum Volatility ETF (NYSEARCA: USMV ) and the iShares S&P 100 ETF (NYSEARCA: OEF ) with safer haven ETFs like the Vanguard Long-Term Bond ETF (NYSEARCA: BLV ) and EDV. If popular stock benchmarks breach 200-day trendlines, I reduce equity exposure and/or employ multi-asset stock hedging by investing in those assets with a history of performing well in moderate-to-severe stock downturns. Click here for Gary’s latest podcast. Disclosure: Gary Gordon, MS, CFP is the president of Pacific Park Financial, Inc., a Registered Investment Adviser with the SEC. Gary Gordon, Pacific Park Financial, Inc, and/or its clients may hold positions in the ETFs, mutual funds, and/or any investment asset mentioned above. The commentary does not constitute individualized investment advice. The opinions offered herein are not personalized recommendations to buy, sell or hold securities. At times, issuers of exchange-traded products compensate Pacific Park Financial, Inc. or its subsidiaries for advertising at the ETF Expert web site. ETF Expert content is created independently of any advertising relationships.