Tag Archives: open-xhr-start

Profiting From Greece And ECB Events

Summary Greek election result and what it means for investors. European Central Bank quantitative easing and what to expect from the Euro. Recommendations to profit from these moves. This is a very unusual article for me, as my regular readers will know, since I generally invest long term. I authored another similar article in March of 2012 about the Greek debt situation. This is a special situations and I believe that such opportunities should not be ignored. I also write a series about hedging and this particular situation falls neatly into that category. There are two issues coming out of Europe over the last week: the European Central Bank [ECB] quantitative easing [QE] program and the Greek election results this Sunday, January 25, 2015. The QE announcement was expected, but the size of the program was about twice what was being rumored and caught the markets by surprise. The Greek election turned out about the way early polls implied but still has the potential to create instability on the continent. The two events taken together sends a message that we should be cautious when investing in Europe. But, then again, there may also be some opportunity to profit. Greek Election With about 90 percent of the votes counted it is projected that the Syriza Party will win the election and come away with a total of 149 of the 300 seats in Parliament. That includes the 50 extra seats given to the winning party and leaves Syriza leader, Tsipras, two seats short of an outright majority. That means that Tsipras will need to entice one of the other smaller parties into forming a government. And that is likely to lead to compromise; on what, I do not know. But without having won outright control, Tsipras may not be able to move as far or as fast as his constituents are expecting. That may be good because it will give Tsipras an excuse and may give him more time to negotiate whatever the eventual agreement with the European Union [EU], ECB and the International Monetary Fund [EMF] from which past bailouts have come. The bottom line, in my humble opinion, is that this creates uncertainty in the EZ. Some expect Greek to exit the EU, others expect at least some Greek debt forgiveness, while others expect Greece leaders to cave into the demands of continued austerity. No one knows for sure what will happen. This uncertainty is likely to further undermine the already weakening Euro currency against other major currencies, especially the U.S. dollar. However, since the worst possible outcome of outright control by Syriza (worst case for the EZ) did not occur, the initial impact could be muted. ECB and QE Investors who own shares of companies that are either domiciled in the Euro Zone [EZ] or conduct significant business there, should consider taking steps to protect holdings from what I expect to be additional downside risk from currency translations. The ECB announced last week its intention to initiate a 1 trillion euro quantitative easing program in March 2015 expected to last through at least September of 2016. Now that the initial impact from the program announcement has taken its toll, we may see the Euro drift sideways unless my interpretation of the Greek election is off. Recall what happened to the Japanese Yen relative to the US dollar after the US ended its QE3 and the Japanese Central Bank announced shortly after that it would expand its QE program in late October of last year. There was an initial steep sell off over the first few days followed by a more gradual, but still significant, continued decline in the value of the Yen over the next four weeks. The Yen has continued to trade with a range since that time, but weekly moves are can still be volatile. See the chart of CurrencyShares Japanese Yen ETF (NYSEARCA: FXY ) below. FXY data by YCharts The Euro has been in a downtrend for the last six months (see chart of the CurrencyShares Euro ETF (NYSEARCA: FXE ) below), but the rate of decent increased about the middle of December when Draghi of the ECB indicated that QE in the EZ was coming soon. During this period it was widely accepted that the ECB would initiate a QE program in the range of 500 billion Euros. After the announcement of one trillion Euros hit on January 22, the Euro fell to an 11-year low near $1.1 / Euro. But the program has not even begun yet and will not get started until March! FXE data by YCharts A prolonged QE program aimed at weakening the Euro against the U.S. dollar and other major currencies will, in my opinion, be successful to the extent that the Euro will weaken further. Of course, the idea is that a weakening Euro will make EZ produced goods more competitive in the global marketplace; hence, increasing demand for EZ goods, creating jobs, increasing GDP and moving inflation up a notch or two. The problem is that other central banks are not likely to sit idly by and do nothing. As a matter of fact, both Canada and Denmark cut rates in the last week and Japan is determined to weaken the Yen further; others will likely follow. In other words, the ECB will probably be successful in weakening the Euro against the U.S. dollar and create inflation, but the other goals are less certain. The U.S. Federal Reserve Bank [FED] is unlikely to take further QE actions as such a move could be construed as a retaliatory move. That could move the world dangerously closer to an all-out currency war; something no one wants or needs. Thus, even with short-term U.S. interest rates pegged near zero, the U.S. dollar is more likely to continue to strengthen against other currencies, especially the Euro. Before I make my recommendations I must stress that using leveraged ETFs is always a very short-term strategy. Holding leveraged ETFs long-term, much more than a week, is generally a losing proposition. If you can’t monitor your positions at least once a day, please don’t consider this trading strategy. Unleveraged ETFs are less volatile and can be held longer. Recommendations PowerShares US Dollar Bullish ETF (NYSEARCA: UUP ) is an unleveraged US Dollar Index ETF that goes up when the US dollar rises relative to a basket of other major currencies, including the euro. Daily average volume is 1.7 million shares, a very important point because you don’t want to trade an ETF that is thinly traded and run the risk not being able to close out a position when you want. My theory is that the uncertainty created by the Greek elections combined with the ECB move with put downward pressure on the Euro over the next few weeks and potentially even longer. I own UUP now and may add to my position, primarily as a hedge against currency translation losses by companies that do extensive business in Europe. This position has done well and I expect the trend to continue (see UUP chart below). UUP data by YCharts ProShares Ultra Short Euro ETF (NYSEARCA: EUO ) is a double-leveraged inverse ETF on the euro that goes down twice the amount that the US dollar increases relative to the euro. EUO daily average volume is about 1.3 million shares, thus providing adequate liquidity also. The unleveraged short Euro ETFs did not have adequate trading volume to warrant a recommendation. I do not hold any EUO at this time but plan to take a short-term position within the next week. This is more of a momentum play and not my usual cup of tea, so my position will be very small and short-lived. The trend for EUO has been strong and I believe that there is still more to come, but for how long I do not know (see EUO chart below). EUO data by YCharts Again, this is meant as a means to protect at least some of what you have, not as a get-rich-quick scheme. Don’t plan to hold the position beyond the point when the prices begin to turn against you. It would be prudent to use trailing stops to protect your capital. A drop of more than five percent is significant, thus I would keep my trailing stops at five percent. The leveraged ETFs are very risky securities, and can lose you money if held long-term. It is the nature of how these securities are designed. They can be solid performers over relatively short periods only. Be careful out there! Additional disclosure: I intend to initiate a short-term position in EUO this week.
A Diversified, High-Income Bond Portfolio For 2015

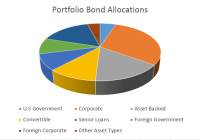
Summary A portfolio of selected bond CEFs provides an average distribution of 8.6%. Since 2007, the composite portfolio of selected bond CEFs outperformed HYG, the popular high-yielding bond ETF. Bond CEFs offer excellent diversification when included in a traditional high-yield bond portfolio. I recently wrote an article on a diversified closed-end fund (CEF) portfolio that included a range of equity funds but had only 28% of the assets allocated to bonds. I realized that many retirees would like to have a higher percentage in bonds, so I wrote this article, which focuses exclusively on bond CEFs. I chose only funds that were in existence during the 2008 bear market so that I could judge performance during a recessionary period. Other criteria included: An average daily volume of at least 100,000 shares per day to facilitate liquidity A distribution of at least 6% without excessive amounts of Return of Capital (ROC) A market cap of at least $150 million, but the larger the better A premium of no more than 5% Using these criteria, I then selected funds that would provide a diversified mix of: government and corporate bonds from both the U.S. and internationally, asset-backed bonds, convertible bonds, and senior loans. The 10 CEFs that I chose are summarized below. There is a large universe of bond CEFs, so I welcome alternative suggestions from readers. BlackRock Duration Income Trust (NYSE: BLW ): This CEF sells for a discount of 8.2%, which is a substantially larger discount than the 3-year average discount of 1.7%. The fund concentrates on intermediate-duration debt securities and senior loans. It has a portfolio of 873 securities, with 41% invested in corporate bonds, 32% in loans, and 12% in asset-backed bonds. About 25% of the portfolio is investment-grade. In 2008, the price of this fund dropped about 25%. The fund utilizes 30% leverage and has an expense ratio of 1.1%. The distribution is 7.6%, funded by income with no ROC. Calamos Convertible Opportunities & Income Fund (NASDAQ: CHI ): This CEF sells for a small premium of 1.1%, which is in contrast to 0.1% average discount over the past 3 years. The fund has a portfolio of 278 securities, with 53% in convertible bonds and 41% in corporate bonds. Only about 17% of the portfolio is rated investment-grade. In 2008, the price of this fund dropped 35%. The fund utilizes 28% leverage, and has an expense ratio of 1.5%. The distribution is 8.9%, funded mostly by income but with some ROC. Calamos Convertible & High Income Fund (NASDAQ: CHY ): This CEF sells at a premium of 3.4%, in contrast to a 3-year average discount of 3.7%. The fund has a portfolio of 277 securities, with 59% in convertibles and 36% in corporate bonds. Only about 15% of the bonds are investment-grade. This fund dropped 27% in price during 2008. It utilizes 28% leverage, and has an expense ratio of 1.5%. The distribution is 8.6%, funded primarily from income, but with some ROC. This fund is about 74% correlated with its sister fund CHI. Western Asset Global High Income Fund (NYSE: EHI ): This CEF sells for a discount of 8.8%, which is a greater discount than the 3-year average discount of 4%. The fund has a portfolio of 558 securities, with 77% in high-yield bonds and 16% in government bonds. This fund lost 30% in 2008. It utilizes 22% leverage, and has an expense ratio of 1.5%. The distribution is a high 10.6%, funded by income with no ROC. Wells Fargo Advantage Multi-Sector Income Fund (NYSEMKT: ERC ): This CEF sells at a discount of 11.5%, which is a larger discount than the 3-year average discount of 8.8%. The fund has a portfolio of 679 securities, spread among corporate bonds (54%), government bonds (19%), senior loans (12%), and asset-backed bonds (6%). About 36% of the holdings are investment-grade. The fund only lost 20% in 2008. It utilized 25% leverage, and has an expense ratio of 1.2%. The distribution is 8.5%, funded by income with no ROC. Eaton Vance Limited Duration Income Fund (NYSEMKT: EVV ): This CEF sells at a discount of 10.8%, which is a larger discount than the 3-year average discount of 4.4%. The fund has a large portfolio of 1692 securities spread across loans (38%), corporate bonds (35%), and asset-backed bonds (24%). About 32% of the holdings are investment-grade. The price of this fund dropped 27% in 2008. The fund utilizes a relatively high 40% leverage, and has an expense ratio of 1.7%. The distribution is 8.7%, funded primarily by income, with a very small ROC component. Western Asset Emerging Markets Debt Fund (NYSE: ESD ): This CEF sells at a discount of 11.1%, which is a larger discount than the 3-year average discount of 7.2%. The fund has a portfolio of 222 securities, with 54% in government bonds, and 46% in corporate bonds. About 64% of the bonds in the portfolio are rated investment-grade. This fund only lost about 20% in 2008. The fund only uses 10% leverage, and has an expense ratio of 1%. The distribution is 8.7%, funded by income with no ROC. MFS Charter Income Trust (NYSE: MCR ): This CEF sells at a discount of 11.7%, which is a larger discount than the 3-year average discount of 7.8%. The fund has a portfolio of 857 securities, with about 45% in corporate bonds, 12% in government debt, and 35% in foreign securities. About 34% of the portfolio is investment-grade. The fund utilizes 15% leverage, and has an expense ratio of 0.9%. The distribution is 6.2%, funded by income with no ROC. PCM Fund (NYSE: PCM ) : This CEF sells at a discount of 1.3%, which is well below the 3-year average premium of 5.8%. The fund focuses on commercial mortgage backed securities and non-investment grade securities. The portfolio is spread over 247 holdings, with 82% in asset-backed bonds and 18% in corporate bonds. About 35% of the holdings are investment-grade. The price of the fund dropped about 30% in 2008. The fund utilizes 32% leverage, and has an expense ratio of 2%. The distribution is 9%, with only a small ROC component. PIMCO Income Opportunity Fund (NYSE: PKO ): This CEF currently sells at a discount of 2.2%, which is in contrast to the 3-year average premium of 2.5%. The portfolio has 470 holdings allocated primarily among asset-backed bonds (42%) and corporate bonds (40%). Only about 30% of the holdings are investment-grade. The price of the fund dropped 24% in 2008. The fund utilizes 38% leverage, and has an expense ratio of 1.9%. The distribution is 8.3%, with only a small return of capital component. For comparison with other popular high-yield bond funds, I also added the following Exchange Traded Fund (ETF) to my analysis. iShares iBoxx $ High Yield Corporate Bond ETF (NYSEARCA: HYG ): This ETF tracks an index of about a thousand high-yield U.S. corporate bonds across all sectors of the economy. The fund does not use leverage, and has an expense ratio of 0.5%. It yields 5.7% without any ROC. During 2008, the price of this ETF dropped by 17%, but the NAV dropped by 23%. It is unusual for an ETF to have a large difference between price and NAV, but this just illustrates the dislocations that occurred during the 2008 bear market. Composite Portfolio If you equal-weight each of the selected CEFs, the resulting composite portfolio has the allocations shown graphically in Figure 1. As you can see, the composite portfolio is well diversified. Numerically, the allocations are: 5% U.S. government, 30% corporate, 16% asset-backed, 11% convertibles, 9% senior loans, 9% foreign government, 16% foreign corporate, and 4% other (cash, preferred issues, etc.). Personally, I would have liked a larger allocation to U.S. government bonds, but it was difficult to find Treasury-focused funds that had distributions exceeding 6%. Overall, this portfolio had 31% investment-grade securities. Figure 1: Composition of bond portfolio The composite portfolio has an average distribution of 8.6%, which certainly meets my criteria for high income. But total return and risk are as important to me as income, so I plotted the annualized rate of return in excess of the risk-free rate (called Excess Mu in the charts) versus the volatility for each of the component funds. I used a look-back period from October 12, 2007 (the market high before the bear market collapse) to 21 January, 2015. The Smartfolio 3 program was used to generate the plot shown in Figure 2. (click to enlarge) Figure 2: Risks versus rewards over the bear-bull cycle The plot illustrates that the CEFs have booked a wide range of returns and volatilities since 2007. To better assess the relative performance of these funds, I calculated the Sharpe Ratio. The Sharpe Ratio is a metric developed by Nobel laureate William Sharpe that measures risk-adjusted performance. It is calculated as the ratio of the excess return over the volatility. This reward-to-risk ratio (assuming that risk is measured by volatility) is a good way to compare peers to assess if higher returns are due to superior investment performance or from taking additional risk. In Figure 2, I plotted a red line that represents the Sharpe Ratio associated with HYG. If an asset is above the line, it has a higher Sharpe Ratio than HYG. Conversely, if an asset is below the line, the reward-to-risk is worse than HYG. Over the bear-bull cycle, all the individual bond CEFs were more volatile than HYG. However, when combined into an equally weighted composite portfolio, the volatility was only slightly more than HYG. This is an illustration of an amazing discovery made by an economist named Markowitz in 1950. He found that if you combined certain types of risky assets, you could construct a portfolio that had less risk than the components. His work was so revolutionary that he was awarded the Nobel Prize. The key to constructing such a portfolio was to select components that were not highly correlated with one another. In other words, the more diversified the portfolio, the more potential volatility reduction you can receive. Some other interesting observations are evident from the figure. All the bonds CEFs had a higher volatility than HYG, but in each case, this was coupled with a higher return. All the CEFs except for CHI were above the “red line,” which means that the investor was adequately compensated for increased risks. The best-performing bond CEF on a risk-adjusted basis was MCR, but PKO was not far behind. The worst-performing bond CEF was CHI, which had a higher return than HYG, but a much larger volatility. This caused the risk-adjusted return associated with CHI to lag slightly behind HYG. The least volatile bond CEF was MCR, and the most volatile was CHI. The composite portfolio handily outperformed HYG on a risk-adjusted basis. I next wanted to assess the diversification of this portfolio. To be “diversified,” you want to choose assets such that when some of them are down, others are up. In mathematical terms, you want to select assets that are uncorrelated (or at least not highly correlated) with each other. I calculated the pair-wise correlations associated with the funds. The data is presented in Figure 3. All the CEFs had relatively low correlations with HYG (in the 40%-60% range). This bodes well for including these CEFs in a more traditional high-yield bond portfolio. Among the CEFs, the correlations were also low, with only a few above 70%. Overall, these results were consistent with a well-diversified portfolio. (click to enlarge) Figure 3: Correlations over the bear-bull cycle My next step was to assess this portfolio over a shorter time frame when the stock market was in a strong bull market. I chose a look-back period of 5 years, from January 2010 to January 2015. The data is shown in Figure 4. During this period, the bond CEFs did not fare as well, with many of the CEF booking a risk-adjusted performance less than HYG. Only 3 of the CEFs (CHY, PKO, and PCM) outperformed HGY. However, I was happy to see that the combined portfolio continued to outperform HYG during this bull market period. (click to enlarge) Figure 4: Risks versus rewards over the past 5 years Based on the above, I wanted to see if the outperformance continued during the more recent past. I next used a look-back period of 3 years, and the results are shown in Figure 5. As you might have expected, HYG had an impressive run during this strong bull period. Only the convertible CEFs (CHI and CHY) were able to keep pace on a risk-adjusted basis. However, as with the 5-year period, the combined portfolio performed well, lagging HYG by only a small amount on a risk-adjusted basis. The major detriment to the portfolio performance was ESD, which has had a horrible 3 years, just barely managing to remain in the black. This was because of a general sell-off in emerging market assets that has only recently abated. Many investors might be tempted to drop ESD from the portfolio, but I am inclined to give it the benefit of the doubt with the expectation that emerging markets may recover in the future. Overall, I continue to be pleased with the portfolio performance. (click to enlarge) Figure 5: Risks versus rewards over the past 3 years Bottom Line The bond CEFs in this portfolio were all volatile, and taken individually, they would not be suitable for a risk-averse investor. As discussed, most of these funds also had substantial losses during 2008. However, if you risk profile allows you to purchase high-yield bonds, the composite portfolio delivered some excellent risk-adjusted performances over the periods analyzed. No one know how this portfolio will perform in the future, but based on past history, I believe it is worthy of consideration for an income investor who is also seeking total return at a reasonable risk.

After Earnings, How Are Oil Service ETFs Looking For 2015?

The oil price slide, which started to hit global headlines in the second half of 2014, has reached such an alarming stage that investors are fervently looking out for the earnings performance of the oil service companies before passing their verdict on investment in energy stocks. The return of worries in the Euro zone, poor data points from Japan and China and no production cut led the commodity to plummet about 60% over the past six months. Presently, oil prices are hovering around five-and half year lows raising uncertainty among producers and forcing them to adopt cost-cutting measures. Though oil price is arguably yet to hit a bottom, the Zacks Industry Rank for the said space is not. Presently, it is in the bottom 9%. Thanks to this outright bearish backdrop, the sector tops investors’ attention list this earnings season as all will be interested to know the direction of oil flow. Let’s delve a little deeper into the earnings and see how things are shaping up for the space. In this piece, we have considered three stocks, namely – Baker Hughes Inc. (NYSE: BHI ) , Schlumberger Ltd. (NYSE: SLB ) and Halliburton Company (NYSE: HAL ) . Among the trio, Schlumberger reported its earnings on January 15 followed by Baker Hughes and Halliburton on January 20. Results in Detail Halliburton – the second largest oil service company – came up with earnings and revenue beat in Q4. Earnings of $1.19 per share from continuing operations beat the Zacks Consensus Estimate of $1.11. Halliburton’s revenues of $8.8 billion reflected a 15% year-over-year improvement and 0.1% beat over the Zacks Consensus Estimate. Shares were up 1.79% in the key trading session following the declaration of results. Improved stimulation work in the U.S. and drilling operations in the Middle East/Asia region led to the beat despite the oil price carnage. Baker Hughes ‘ adjusted earnings from continuing operations of $1.44 a share beat the Zacks Consensus Estimate of $1.08 and improved from the year-ago figure of $1.02 per share. Its revenues of $6.64 billion grew 13.0% and surpassed the Zacks Consensus Estimate of $6.38 billion. BHI too added about 1.24% following the release. Schlumberger – the world’s largest oilfield services provider – came up with a mixed Q4 by reporting adjusted earnings of $1.50 per share (excluding special items), which edged past the Zacks Consensus Estimate of $1.47 and the year-ago number of $1.49. However, the total revenue of $12.6 billion expanded 6.2% year over year but fell shy of the Zacks Consensus Estimate of $12.7 billion. Still, SLB has advanced more than 6% following its results only to slide 1.05% on January 20 as the company decided to slash 9,000 jobs . However, this is not something new for an oil producer, as HAL and BHI are considering such measures too. Market Impact The space got mixed signals thanks to varied performances. The merger between Halliburton and Baker Hughes as well as decent earnings have gone in favor of the companies as this would help the duo to withstand the current slump more efficiently. While a single stock pick is always an option to play earnings, we could see a deep impact on ETFs that are heavily invested in these popular oil service companies. Notably, the ETF route will help investors to mitigate one company’s average performance with the other company’s stellar results. Below, we have highlighted three oil-services ETFs with considerable allocation to SLB, HAL and BHI that could be in focus following oil-service earnings: iShares U.S. Oil Equipment & Services ETF (NYSEARCA: IEZ ) This ETF – tracking the Dow Jones U.S. Select Oil Equipment & Services Index – invests about $336 million of assets in 53 securities, focusing solely on the energy world. In-focus SLB takes up the first position here with 21.1% of holdings. Generally, when one stock accounts for as much as 21% of an ETF’s weight, its individual performance decides much of the fund’s price movement. HAL takes up the second position with about 9.3% of total assets while BHI gets the fourth position with about 7.4% share. The fund lost about 7.9% in the year-to-date frame (as of January 20, 2015) thanks to the recent energy equity sell-off. However, following the release of the earnings by the trio, IEZ has added about 4.3% (as of January 20, 2014). IEZ is a cheaper fund, charging 0.43% for its expense ratio. The fund has a Zacks ETF Rank #4 (Sell) with a High risk outlook. Market Vectors Oil Services ETF (NYSEARCA: OIH ) OIH tracks the Market Vectors US Listed Oil Services 25 Index. The index invests $978.0 million of assets in 26 holdings. OIH devotes as much as 19.7% of the portfolio weight to SLB, followed by 11.6% in HAL. BHI gets the fourth spot with about 5.38% of the total allocation. OIH is cheap in the space with an expense ratio of 0.35%. The fund is down about 7.8% so far this year (as of January 20, 2015) but has returned more than 4.3% since January 15. OIH has a Zacks ETF Rank #4 with a High risk outlook. PowerShares Dynamic Oil & Gas Services Fund (NYSEARCA: PXJ ) This product offers exposure to 30 energy stocks with BHI, SLB and HAL at the first, second and third positions, respectively, allocating more than 5% of total assets to each. PXJ tracks the Dynamic Oil & Gas Services Intellidex Index and has amassed about $56 million thus far. The ETF charges 61 bps in fees, so it is a bit more expensive than some of its counterparts in the space. The fund has added about 3.8% following the earnings release of the three companies, but has lost about 10% year to date. PXJ has a Zacks ETF Rank #5 (Strong Sell) with a High risk outlook.