Managing Volatility, Earnings And Why Agriculture?
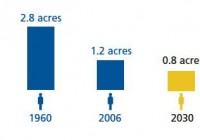
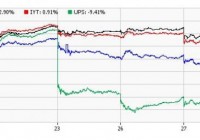
The portfolio will always have cash on had to deploy into depressed sectors. Currently we are watching agriculture & Gold mining shares. Agriculture has fantastic fundamentals. I can only see future growth in this sector. Earnings on one of our underlyings (Proctor & Gamble) has been disappointing. Nevertheless we will continue to hold as the company is going through a period of transition. So we have started a portfolio which is producing regular income ( I will post January Income results at the end of the month) but what do we do when we want to add savings to our portfolio on a monthly or yearly basis? To explain this point further, let me illustrate an example. Imagine that at a given point in time in our portfolio (asset class A & asset class B) have done the following over 5 years. Both asset classes started out at zero and we invested $10,000 per year into each asset class. Study both tables below and choose the asset class that you think would have given the best return. Asset Class A Year 1 Unchanged – $100 per share Year 2 Value Drops to $60 per share Year 3 Remains unchanged at $60 per share Year 4 Shoots up to $140 per share Year 5 $100 per share – Where it started Asset Class B Year 1 Unchanged Year 2 Value Increases to $110 per share Year 3 Increases to $120 per share Year 4 Increases to $130 per share Year 5 Finished at $140 per share It may come to surprise you that “Asset Class A” (higher volatility) would have yielded better results and more income. Asset Class B would have risen to $59,150 but “Asset Class A” would have risen to $60,048! – a profit of $10,048. Moreover “Asset Class A” finishes where it started – at $100 per share! How can we use this information for our 1% portfolio? Two things are obvious in my mind. 1. We will never have all our capital invested 2. When individual asset classes become depressed, we will aggressively invest more into that sector. We currently have $460k invested out of a possible million and the depressed sectors that are on my radar are agriculture and Gold mining stocks. We already have capital deployed in these sectors but we will deploy more if we see more weakness. Yesterday we invested in (NYSEARCA: MOO ) and (NYSEARCA: DBA ). Why agriculture and why now? The fundamentals for this asset class are excellent. Let’s go through them. 1. We are losing farmland at an astonishing rate. Moreover, when you combine this with an ever increasing population, this sector screams under-supply. The graphic below shows where we are in terms of arable land on a per person basis 2. The biofuel industry has also put pressure on the agricultural industry. I expect corn, sugar and our ETFs to rise when the price of oil rises as governments continue to invest in renewable energies such as corn and sugar cane-based ethanol. 3. 3rd fundamental is China. With a population of well over a billion and with millions of Chinese joining the middle class, grains supply are taking a hit. Wheat supplies are already falling as middle class Chinese turn to meat. In order to produce meat on mass, cattle must be fed grains. There is a direct link between a growing middle class and higher grain consumption. If China’s middle class continues to grow, grains supply will fall even more 4. Agricultural products could really spike in price if China doesn’t sort out their water problem. China feeds 20% of the world’s population so obviously water is fundamental in maintaining this part of their economy. The problem is far from solved despite the huge sums of money that has been invested by the government. Any disruption here would be ultra bullish for our agriculture ETFs. There are so many reasons to be long agriculture. We will leave our allocation as it is at the moment and then invest more aggressively when we see the trend changing. Earnings are coming in thick and fast in the US but for the most part, they have been disappointing. Big companies such as Microsoft (NASDAQ: MSFT ), Caterpillar (NYSE: CAT ) and (NYSE: UPS ) missed earnings estimates by a big margin. Moreover Procter & Gamble (NYSE: PG ) announced a reduction in earnings of 34% ! Since we have Procter & Gamble in our portfolio, I want to talk a bit about it here. First of all, profits are going to be effected in the short term because of the strong dollar. Its PE ratio is now 22, price to sales ratio is 2.92 and projected sales growth for 2015 is 2.9%. Analysts believe this company is expensive as its stock rose 14% in value in 2014 in the midst of bad earnings. However we are income investors and Procter & Gamble has raised its dividend for 58 years straight! Many investors forget that yields in bellwether stocks go up when the stock price falls. It raised its dividend relentlessly in 2008 and I have no doubt this measure will continue. The company continues to grow even though profits are down in the short term. Also the company needs time to restructure. In 2014 alone Procter & Gamble cut costs aggressively by deciding to stop marketing underperforming brands so it could concentrate on their top performing brands. This was a smart move in my opinion. Usually in business, 80% of your sales come from 20% of your products (80-20 rule). Therefore the company has decided to focus exclusively on its profitable products and ditch the lethargic ones. Firstly it exited the pet food industry last April by selling its pet food brands for almost $3 billion. Then last November, it sold its Duracell brand to Berkshire Hathaway (NYSE: BRK.A ) (NYSE: BRK.B ). Then last month the company sold its Camay and Zest brands to Unilever (NYSE: UL ). A strong dollar is going to make Procter & Gamble even more competitive which will benefit the company and shareholders in the long run. We will continue to hold in our 1% portfolio because the company has always adapted to changing times as the long term chart shows.


