Tag Archives: onload

Cybersecurity: The One ETF You Need To Know For 2015

The Sony hack and latest credit card breaches show demand for the market. The ETF’s top ten holdings are relative small companies with eight being worth less than $2 billion. The ETF is the only pure play in the sector and should see strong demand as the go to product for the market. In November, a new ETF hit the market that for the first time offered investors a way to get a basket of stocks in one of the hottest sectors. PureFunds launched the ISE Cyber Security ETF (NYSEARCA: HACK ), which remains the first and only true cybersecurity ETF for investors. With all of the talk about the Sony (NYSE: SNE ) hacking and what it means for companies, this fund is likely to come out a winner for many years as trends shift towards securing the world’s data. According to this interview , the inspiration for the fund was twofold. The company wanted to showcase the potential of the cyber security industry and also saw the lack of an investment vehicle in the sector. When asked about the non-direct competing ETFs that are in the technology sector, the company pointed something very interesting out. The larger PowerShares QQQ Trust ETF (NASDAQ: QQQ ) and Technology Select Sector SPDR ETF (NYSEARCA: XLK ) have less than 5% overlap with ISE Cyber Security. Here is a look at the top ten holdings as of December 20th: Imperva (NYSE: IMPV ): 8.4% Vasco Data (NASDAQ: VDSI ): 8.3% Infoblox (NYSE: BLOX ): 5.9% Palo Alto Networks (NYSE: PANW ): 5.8% Qualys (NASDAQ: QLYS ): 5.8% IntraLinks (NYSE: IL ): 5.1% Proofpoint (NASDAQ: PFPT ): 5.1% Radware (NASDAQ: RDWR ): 4.8% Fortinet (NASDAQ: FTNT ): 4.7% Barracuda Networks (NYSE: CUDA ): 4.7% In total, the fund has 26 holdings. Most of the top ten holdings aren’t immediately recognizable. In fact, two of the bigger names in cyber security, Symantec (NASDAQ: SYMC ) and FireEye (NASDAQ: FEYE ), make up 4.5% and 3.4% of the ETF respectively. It is worth noting that the average market capitalization of the top ten holdings is $2.55 billion. This figure comes with two of the funds trading less than $1 billion and eight of the top ten holdings having market capitalizations under $2 billion (Fortinet $5.1 billion, Palo Alto Networks $10.1 billion). I think this represents a huge opportunity as these companies can grow fast in this market and offer sizable returns. Cybersecurity is a huge market and is continuing to grow. The Sony hack that left the paper using pen and paper has shown how vulnerable companies are and also what the cleanup process can look like. The FBI also said that 90% of companies are vulnerable and could have been attacked just like Sony was. Sony recently hired Mandiant Forensics, a unit of FireEye to help with the cleanup. Mandiant is an incident response firm that helps victims of breaches by cleaning up and restoring. Mandiant has helped with some of the biggest security breaches, including the infamous 2013 Target (NYSE: TGT ) hack. FireEye makes up 3.4% of the ETF, but shows exactly what kind of growth the industry is seeing. Staples (NASDAQ: SPLS ) recently estimated that 1.16 million customers may have been impacted by a credit card hack at its stores. This follows up a two-year period that has seen Home Depot (NYSE: HD ), Target, Kmart, Dairy Queen, and JPMorgan (NYSE: JPM ) in the news for security breaches. As the publicity spreads on these issues and also the claims filed by victims, companies are forced to upgrade security and pay the companies in this portfolio. Investing in a cybersecurity ETF means you win as companies protect themselves. More hacks may make the investments worth more, but investors should rest assured that these companies don’t need hacks to survive, but rather companies to use their prevention software and intelligence to combat potential attacks. One situation investors and companies should be watching is the Regin Trojan that Symantec brought to the public’s attention recently. The top tier espionage tool is being used against governments, infrastructure, businesses, researchers, and individuals. Since 2008, Regin has been using a “degree of technical competence rarely seen.” These are scary times for cybersecurity as data continues to seem unsafe and readily accessible by those who want to find it. The ETF has an expense ratio of 0.75%. The fund has $66 million in assets currently, but I expect that to grow as more information and publicity comes out for this one of a kind ETF. Average volume is 153,000 shares a day. As we head into 2015, I have to recommend investors take a good hard look at this ETF. Despite trading at its highest point since its short inception, I believe the fund has much more to offer. This is a red hot sector that is going to see billions of dollars incoming from large and small companies alike. The company has a good basket of stocks and with lower market capitalization stocks up top, may grow faster than investors are expecting.
Stock Picking Grades For Small Cap Value Style Fund Managers

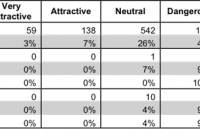
Summary In this report, we focus on how much Small Cap Value style fund managers allocate to the best stocks compared to how many good stocks are available in the style. Many ETFs and mutual fund managers do a poor job identifying quality stocks for their funds. These funds are not worth owning at any cost. The emphasis that traditional research places on low costs is a positive for investors, but low fees alone do not drive performance. Only good holdings can. This report shows how well Small Cap Value ETFs and mutual fund managers pick stocks. We juxtapose our Portfolio Management Rating on funds, which grades managers based on the quality of the stocks they choose, with the number of good stocks available in the style. This analysis shows whether or not ETF providers and mutual fund managers deserve their fees. For example, if a fund has a poor Portfolio Management Rating in a style where there are lots of good stocks, that fund does not deserve the fees it charges, and investors are much better off putting money in a passively-managed fund or investing directly in the style’s good stocks. On the other hand, if a fund has a good Portfolio Management Rating in a style where there are lots of bad stocks, then investors should put money in that fund, assuming the fund’s costs are competitive . Figure 1 compares the number of good stocks in the Small Cap Value style to the number of good funds. 197 out of the 2131 stocks (over 10% of the market value) in Small Cap Value ETFs and mutual funds get an Attractive-or-better rating. Zero out 15 Small Cap Value ETFs allocate enough to quality stocks to earn an Attractive-or-better Portfolio Management Rating. Mutual fund managers have not fared any better. Zero out of 273 Small Cap Value mutual funds allocate enough of their assets to quality stocks to earn an Attractive-or better Portfolio Management Rating. ETF providers and mutual fund managers need to do a better job to justify their fees. With no high quality funds available, 100% of investor assets in Small Cap Value ETFs are invested in ETFs with Dangerous Portfolio Management Ratings. Investors have almost no choice in this style with only one ETF even receiving better than a Dangerous Portfolio Management Rating. The picture is no better for mutual fund investors as 96% of investor assets are allocated to mutual funds with Dangerous-or-worse Portfolio Management Ratings. Figure 1: Small Cap Value Style: Comparing Quality of Stock Picking to Quality of Stocks Available (click to enlarge) Sources: New Constructs, LLC and company filings The First Trust Mid Cap Value AlphaDEX ETF (NYSEARCA: FNK ) has the highest Portfolio Management Rating of all Small Cap Value ETFs and earns my Neutral Portfolio Management Rating. The Prudential Small-Cap Value Fund (MUTF: PZVAX ) has the highest Portfolio Management Rating of all Small Cap Value mutual funds and earns my Neutral Portfolio Management Rating. The iShares Russell 2000 Value ETF (NYSEARCA: IWN ) has the lowest Portfolio Management Rating of all Small Cap Value ETFs and earns my Dangerous Portfolio Management Rating. The Aston/River Road Independent Value Fund (MUTF: ARVIX ) has the lowest Portfolio Management Rating of all Small Cap Value mutual funds and earns my Very Dangerous Portfolio Management Rating. Schweitzer-Mauduit International (NYSE: SWM ) is one of my favorite stocks held by Small Cap Value ETFs and mutual funds and earns my Attractive rating. Over the past ten years, Schweitzer has grown after-tax profit ( NOPAT ) by 13% compounded annually. Schweitzer also currently earns a top-quintile return on invested capital ( ROIC ) of 16%. Despite this outstanding profit growth, Schweitzer remains undervalued. At its current price of ~$44/share, SWM has a price to economic book value ( PEBV ) ratio of 1.1. This ratio implies that the market expects Schweitzer to grow NOPAT by only 10% from its current levels over the remainder of its corporate life. This expectation is rather low given the double-digit NOPAT growth achieved for the past decade. Unit Corporation (NYSE: UNT ) is one of my least favorite stocks held by Small Cap Value ETFs and mutual funds and earns my Very Dangerous rating. Over the past eight years, Unit’s NOPAT has declined by 1% compounded annually. The company currently earns a bottom-quintile ROIC of 5%, down from 19% in 2005. Unit has generated positive economic earnings in just one of the last 16 years covered by our model. Despite its lack of profit growth, UNT is rather overvalued. To justify its current price of ~$46, UNT must grow NOPAT by 9% compounded annually for the next 11 years. Such a high profit growth expectation seems overly optimistic given this company’s track record of declining profits. Kyle Guske II contributed to this report. Disclosure: David Trainer and Kyle Guske II receive no compensation to write about any specific stock, style, or theme.

The Various Flavors Of Long/Short Equity Funds

History seems to favor long/short strategies. Just take a look at the 20-year track record of long/short hedge funds. Cumulatively, long/short plays have bettered the S&P benchmark by 62 percent with a third less volatility. This article first appeared at wealthmanagement.com . You have to wonder why anyone would want to launch a domestic long/short equity fund these days. The S&P 500 Index has climbed 15 percent in the last 12 months. Buying a low-cost index tracker like the SPDR S&P 500 ETF (NYSEARCA: SPY ) or the iShares Core S&P 500 ETF (NYSEARCA: IVV ) seems like a no-brainer. Despite this, alternative asset managers persist. First Trust Advisors recently debuted the First Trust Long/Short Equity ETF (NYSEARCA: FTLS ) , an actively managed exchange traded portfolio that exploits forensic accounting to find its investment targets. What’s that, you say? Well, as First Trust’s Ryan Issakainen puts it, the fund’s managers use a proprietary methodology that measures the aggressiveness of a publicly traded company’s accounting practices. Firms with low-quality earnings (read: “aggressive accountancy”) tend to be associated with lower future stock returns compared to more conservative companies. Higher-quality earnings, in this model, portend better returns. FTLS buys high-quality stocks while shorting the low-quality ones. Over FTLS’ brief life, there seems to be something to the quality notion. The fund was launched on Sept. 9 and, through Nov. 20, has outdone the S&P 500 by nearly 60 basis points (0.57 percent, to be exact) with significantly less volatility. The question is, of course, can this last? History seems to favor long/short strategies. Just take a look at the 20-year track record of long/short hedge funds. Cumulatively, long/short plays have bettered the S&P benchmark by 62 percent with a third less volatility. (See Chart 1.) A caveat here. Hedge funds labeled as “long/short” could be trading in myriad investments, including equities, bonds, currencies or options. We need to take a closer look at equity-only portfolios. And we should concern ourselves with publicly traded products. Searching for long/short equity portfolios in the mutual fund or ETF realms requires some discernment. There’s a lot of dirt in the long/short category. Some funds labeled “long/short” are, in fact, market-neutral portfolios—meaning they target a zero beta. Not so with true long/short products: Beta, while potentially mitigated by short sales, isn’t eliminated entirely. Among long/short domestic equity mutual funds ranked by Morningstar, this year’s top five include: Logan Capital Long/Short Fund (MUTF: LGNMX ) — Buying targets include large-cap stocks with potential for rising earnings growth along with those delivering high dividends. Short sale targets include companies with deteriorating financial positions across all capitalization tiers. Schwab Hedged Equity Fund (MUTF: SWHEX ) — Invests by taking long and short positions in stocks based on a proprietary rating system that evaluates fundamentals, valuation and momentum. Highly-rated stocks are bought; low-ranked issues are sold short. CBRE Clarion Long/Short Fund (MUTF: CLSVX ) — Concentrating in the real estate sector, CLSVX managers rank companies using proprietary criteria, then finance long exposures in excess of the fund’s net asset value with short sales of low-ranked stocks. AmericaFirst Defensive Growth Fund (MUTF: DGQAX ) — Another concentration product, this fund focuses its buying interest on defensive, non-cyclical equities, namely consumer staples and healthcare. Short sale candidates are drawn from any industry. Natixis Tactical U.S. Market (MUTF: USMAX ) — Fund managers use a risk model to throttle this fund’s exposure to the domestic market. A positive risk-return tradeoff warrants overexposure through derivatives, while a negative signal triggers a beta-reduction strategy. Clearly, there was a price paid by mutual fund shareholders for long/short equity exposure over the last 12 months. None of the top five funds outdid the S&P 500’s total return, even though most cranked out positive alpha. The reason for the seeming disparity? Beta. Alpha measures a fund’s return against the beta-adjusted benchmark. Four of the five funds were less volatile than the S&P index. Then there’s the annual expense. Long/short plays aren’t cheap. On a market-weighted basis, investors in these five funds forked over 1.9 percent to the portfolio managers. Exchange traded funds boast lower holding expenses, but pickings in the domestic long/short equity sector are pretty sparse. There’s a suite of four thematic QuantShares ETFs that are lumped into the long/short category, but they’re really market-neutral portfolios. Among more than 1,600 extant exchange traded products, there are only two—with the exception of the new FTLS portfolio—that can be properly tagged as domestic long/short equity ETFs: ProShares RAFI Long/Short ETF (NYSEARCA: RALS ) — An index tracker based on the Research Affiliates Fundamental Index (RAFI). Long positions are undertaken in companies with better fundamental metrics—i.e., RAFI weights—relative to their market cap weights, while stocks with smaller RAFI weights are shorted. ProShares Large Cap Core Plus (NYSEARCA: CSM ) — CSM aims to outperform the S&P 500 while maintaining a market-like beta. The fund tracks the Credit Suisse 130/30 Large Cap Index which overweights highly ranked stocks on the long side, financed by short sales of issues with low or negative expected alpha. Long/short ETFs, as you can see in Table 2, are a mixed bag. The smallish RALS portfolio hasn’t benefitted from the past year’s beta bonanza, while CSM took advantage of it in spades. This shouldn’t be a surprise. RALS, most often thought of as an absolute value play, equally weights its long and short exposures. CSM, in contrast, skews to the long side: 130 percent of its net asset value is committed to long positions, 30 percent to shorts. CSM’s asset base, at $487 million, is nearly eight times larger than that of RALS, tilting the long/short ETF category’s market-weighted expense to 51 basis points (0.51 percent), a quarter of the expense borne by investors in the five mutual funds featured in Table 1. The First Trust FTLS fund comes to market with an expense ratio of 99 basis points, cheap by mutual fund standards but pricey when measured against ETFs. FTLS expects to be 80 to 100 percent invested in long positions, complemented by short positions ranging from zero to 50 percent. “As of October 31,” says First Trust Portfolio Manager Mario Manfredi, “the fund had long positions equal to 99.6 percent of NAV and short positions equaling 20.1 percent, for a net market exposure of 79.5 percent.” It’s early days for the fund, but the metrics look promising. FTLS exhibits an r-squared (r2) coefficient of 94 against the S&P 500, with a beta of 83. If the fund continues on its present trajectory for a full year, an alpha north of five could be expected. Not quite that of CSM, but certainly better than RALS. Presently, FTLS goes tradeless about a third of the time. In 17 of the last 53 trading sessions, there’s been zero volume. That doesn’t worry Manfredi. “It’s not unusual for a newly launched ETF to have limited or no trading volume on many days,“ he says. “In our experience, as an ETF gradually builds a track record, interest grows and trading volume follows. We feel that alternatives as an asset class are here to stay, as demonstrated by the growth in assets and overall strategies over the last six years. We have a strong sales and marketing team who we are very confident will drive interest in the fund by working with advisors to help them fulfill their clients’ objectives.” Disclosure: None