Tag Archives: onload

Parkit Enterprise Inc.: Pay Discount On Parking Assets, Get Asset Management With Significant Multi-Bagger Potential For Free

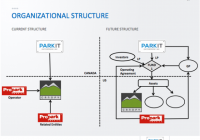
Summary Parkit is a rare opportunity to own a start-up asset manager that is likely to raise significant capital in 2015 to execute on their strategy. Parkit and ProPark combine to create a competitive advantage and have a track record of success which shall help raise capital. Management is extremely bullish and CEO has been buying on the open market extremely consistently at prices higher than today. Shares trade at a significant discount to NAV and investors get the asset management business for free. We see multi bagger potential. (Note: Parkit is also traded on the Canadian TSX Venture Exchange under the ticker PKT.V. Volume on the Canadian exchange is greater than on the OTCQB shares.) We are continuously looking for a business with quality economics run by incentivized managers and where the market is getting the risk/reward ratio very wrong. Strong downside protection is absolutely paramount as the upside will take care of itself with upcoming catalysts. To find such an opportunity in a frothy market such as today one must be willing to search through some obscure places. For 2015, we will be closely following a small parking garage owner based in Canada called Parkit Enterprise Inc. (OTCQX: PKTEF ). The company owns equity in two US off-airport parking garages and has been working on transitioning to becoming a fund manager that aggregates high quality income producing parking assets via a private equity platform. We think the market is serving up a very attractive opportunity as it is extremely rare for the investing public to have the ability to invest in an emerging asset manager. Most often those opportunities are only available to employees or private equity investors. Even rarer is that Parkit already has a track record, has operating assets and is cash flow positive. Currently trading at a discount to NAV on the company’s current owned parking assets, we think the low US$0.40s (mid CAD $0.40s) is a very cheap price to pay for Parkit and does not at all account for the upside potential as a fund manager of quality parking lots. We will be watching Parkit very closely as capital is raised for their first fund over the next few quarters. Management has significantly raised their guidance on funds they will be able to raise and if properly executed, this company is worth many multiples today’s price. History and Fund Manager A Long Time Coming In years past, Parkit was originally called Greenspace and previous management before 2012 did not have a coherent strategy. They helped greenfield the construction of the Canopy parking garage located right outside Denver International airport (completed in 2010), but they ran a bloated cost structure which ultimately almost led to the company going broke even as Canopy performed well. To help transition the company into a leading parking industry company, they brought on Rick Baxter as CEO, some other talented managers and a board of directors with the private equity experience to turn the ship around and execute on an asset manager strategy. Since 2012 when management changes occurred, the company has paid down debt, set the platform for the company’s new fund management strategy and did this while management did not pay themselves for a year and a half. Management decided to take the compensation that accrued to them and roll that over as equity into the company. Unwarranted Recent Price Dive You would expect the market to be reacting positively to Parkit’s turnaround and future prospects, which it did to some degree in April after the announcement of the Expresso acquisition; however, shares have been falling from a high of $0.70 in both the Canadian and US listed shares since October. We think that the market is overreacting to the combination of the oil sell off and the recent resignation of John LaGourgue, VP of Corporate Communications, who was extremely bullish on the company’s long-term prospects. We think that the oil price drop does not change the investment thesis and actually could increase drivers’ interest to travel and park in parking lots. Also, LaGourgue left for personal reasons and as a sign of interest in the company’s long-term prospects he continues to keep 85-90% of the shares and options in Parkit. Keep in mind, many of his shares were purchased on the open market and that he likely sold some shares to diversify his investments. Business Current And Going Forward (click to enlarge) (Source: Parkit Presentation) Parkit has been operating in the past and currently under the model to the left. Parkit owns an equity stake in the Canopy and Expresso garages alongside ProPark America and a few other outside investors. Parkit does not operate these assets, ProPark America provides those services as that is within their circle of competence. Previously Parkit did not bring too much to the relationship other than the capital to invest into Canopy, but that is changing drastically as the new strategy emerges. Parkit’s new strategy is to, to put it simply, set up and run a parking garage private equity fund not too different from an asset manager in structure. As seen in the chart above and to the right, Parkit has already set up a fund with ProPark to act as a platform to raise institutional money to then be used to aggregate parking assets that both Parkit and ProPark manage. Parkit and ProPark both are General Partners (50:50 split) and will receive hedge fund like management fees (0.5-1% of AUM), acquisition fees ( Additional disclosure: This article is meant for instructional purposes and not meant as a recommendation to buy or sell. We are human and can be wrong, especially with our forecasts, so it is extremely important to do your own homework. The only kind of intelligent investing is through your own due diligence. We own both PKTEF and PKT.V.
SCHA Looks Like A Nice Complimentary Holding To Enhance A Diversified Portfolio

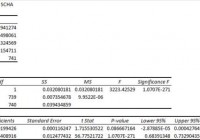
Summary I’m taking a look at SCHA as a candidate for inclusion in my ETF portfolio. The expense ratio relative to the diversification is fantastic. The moderate level of correlation to major funds helps SCHA find a place. I wouldn’t consider SCHA as a core holding, but I may choose it for 5% to 10% of the portfolio. I’m not assessing any tax impacts. Investors should check their own situation for tax exposure. Investors should be seeking to improve their risk adjusted returns. I’m a big fan of using ETFs to achieve the risk adjusted returns relative to the portfolios that a normal investor can generate for themselves after trading costs. I’m working on building a new portfolio and I’m going to be analyzing several of the ETFs that I am considering for my personal portfolio. One of the funds that I’m considering is the Schwab U.S. Small-Cap ETF (NYSEARCA: SCHA ). I’ll be performing a substantial portion of my analysis along the lines of modern portfolio theory, so my goal is to find ways to minimize costs while achieving diversification to reduce my risk level. What does SCHA do? SCHA attempts to track the total return of the Dow Jones U.S. Small-Cap Total Stock Market Index. At least 90% of funds are invested in companies that are part of the index. SCHA falls under the category of “Small Blend”. Does SCHA provide diversification benefits to a portfolio? Each investor may hold a different portfolio, but I use (NYSEARCA: SPY ) as the basis for my analysis. I believe SPY, or another large cap U.S. fund with similar properties, represents the reasonable first step for many investors designing an ETF portfolio. Therefore, I start my diversification analysis by seeing how it works with SPY. I start with an ANOVA table: (click to enlarge) The correlation is about 90%. This is a fairly moderate correlation. It’s low enough that we have a chance at lowering the risk level of a total portfolio so long as the standard deviation is not too high. Standard deviation of daily returns (dividend adjusted, measured since January 2012) The standard deviation isn’t great, but it is acceptable. For SCHA it is .9294%. For SPY, it is 0.7300% for the same period. SPY usually beats other ETFs in this regard, so that isn’t a major issue. Mixing it with SPY I also run comparisons on the standard deviation of daily returns for the portfolio assuming that the portfolio is combined with the S&P 500. For research, I assume daily rebalancing because it dramatically simplifies the math. With a 50/50 weighting in a portfolio holding only SPY and SCHA, the standard deviation of daily returns across the entire portfolio is 0.8094%. If we drop the position to 20% the standard deviation goes down to .7559%. In my opinion, that’s still too high. Once we drop it down to a 5% position the standard deviation is .7357%. If I include SCHA, I would probably seek to use an exposure level around 5%, but could potentially go as high as 10%. Why I use standard deviation of daily returns I don’t believe historical returns have predictive power for future returns, but I do believe historical values for standard deviations of returns relative to other ETFs have some predictive power on future risks and correlations. Yield & Taxes The distribution yield is 1.43%. The SEC yield is 1.30%. In my opinion, these yields make the index less appealing for a retiring investor, but an argument could still be made for a position as large as 5% because of the correlation being down to almost 80%. I’m not a CPA or CFP, so I’m not assessing any tax impacts. If I were using SCHA, I would want it to be in a tax exempt account to remove any headaches associated with frequent rebalancing. Expense Ratio The ETF is posting .08% for an expense ratio. I want diversification, I want stability, and I don’t want to pay for them. The expense ratio on this fund is still within my comfort range. This expense ratio is lower than SPY, but higher than (NYSEARCA: SCHX ). SCHX is an alternative to SPY that I found more appealing. Market to NAV The ETF is at a .07% premium to NAV currently. I’m not thrilled about that, but it isn’t terrible. However, premiums or discounts to NAV can change very quickly so investors should check prior to putting in an order. Largest Holdings The portfolio is wonderfully diversified. The largest position is extremely short duration bonds at .67%. I suspect the ETF is using this as a method for storing dry powder rather than holding cash. That would be a fine solution in my book and I don’t mind seeing it in the portfolio as long as it is less than 1% of assets. I don’t want to be paying an expense ratio on a significant amount of funds that are not invested. For the real investments of the fund, the vast majority are under .30%. This is spectacular diversification and it is remarkable to find this with an expense ratio of only .08%. (click to enlarge) Conclusion I’m currently screening a large volume of ETFs for my own portfolio. The portfolio I’m building is through Schwab, so I’m able to trade SCHA with no commissions. I have a strong preference for researching ETFs that are free to trade in my account, so most of my research will be on ETFs that fall under the “ETF OneSource” program. So far, I like SCHA for exposure to the smaller capitalization side of the market. The moderate correlation helps to mitigate the higher standard deviation of returns and makes this ETF look like a nice fit for a small portion of the portfolio. For me, that’s 5 to 10%. I’d be concerned about investors considering it a core asset and putting in 20% or more, but it looks like a nice piece for that small position in the portfolio. Additional disclosure: Information in this article represents the opinion of the analyst. All statements are represented as opinions, rather than facts, and should not be construed as advice to buy or sell a security. Ratings of “outperform” and “underperform” reflect the analyst’s estimation of a divergence between the market value for a security and the price that would be appropriate given the potential for risks and returns relative to other securities. The analyst does not know your particular objectives for returns or constraints upon investing. All investors are encouraged to do their own research before making any investment decision. Information is regularly obtained from Yahoo Finance, Google Finance, and SEC Database. If Yahoo, Google, or the SEC database contained faulty or old information it could be incorporated into my analysis. The analyst holds a diversified portfolio including mutual funds or index funds which may include a small long exposure to the stock.

Are Rate-Sensitive ETFs Suggesting Economic Weakness Ahead?

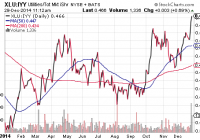
I am baffled by the economic acceleration certainty that nearly every respected voice has endorsed. In spite of the rosiest government data on jobs and GDP, which ETF asset classes proved most resilient in a month of volatile price movement? Utilities and REITs. The more the public is being told about the inevitability of rate increases, the greater the momentum for proxies like XLU and VNQ. Lost in the bull market euphoria is the reality that economists have been dead wrong about the direction of asset prices, particularly bond prices. Last December, when 55 of the most prestigious economists across a wide range of institutions had been polled by Bloomberg about where the 10-year yield (3.0%) would end the year, each of the 55 professionals anticipated higher rates. The average of those estimates? 3.41%. And yet, the 10-year will finish the year closer to 2.25%. That is one heck of an astonishing miss for the entire professional community. This December, polling of economists has produced an average forecast for the 10-year yield at 3.0% by the close of 2015. In other words, they expect intermediate term rates will climb in 2015, and yet, the projections merely approximate where 2013 ended. Even if the recent crop of poll respondents are correct this time around, what does this “non-normalization” of rates tell us about the highly touted strength of the U.S. economy? For all the hoopla, I am baffled by the economic acceleration certainty that nearly every respected voice has endorsed. Will Q4 gross domestic product (GDP) be as robust as the 5% in Q3? Not likely. Will Q1 2015 be better than the average of 2.1% sub-par growth that has existed each year since the Great Recession ended? Probably not. For one thing, lower bond yields have been warning U.S. investors that the world’s stagnation alongside regional recessions will eventually weigh down the U.S. It is one thing to pretend that the U.S. is a self-contained economic island, yet quite another thing to ignore the reality that close to 50% of corporate profits come from overseas. Moreover, there are a variety of potential crises that could sap the world (and yes, the U.S.) of economic demand, from a disorderly slowdown in China to an emerging market credit collapse to a second iteration of a euro-zone break-up scare. Need proof that scores of investors remain unconvinced by the notion that all is perfect in stock-land? In spite of the rosiest government data on jobs and GDP – in spite of strong retail sales as well as consumer confidence readings – which ETF asset classes proved most resilient in a month of volatile price movement? Utilities and REITs. Are The Bets On Lower Rates Still Continuing? MOM% SPDR Select Sector Utilities (NYSEARCA: XLU ) 9.0% iShares DJ Utilities (NYSEARCA: IDU ) 8.7% Vanguard Utilities (NYSEARCA: VPU ) 8.6% iShares Cohen Steers Realty Majors (NYSEARCA: ICF ) 4.2% Vanguard REIT (NYSEARCA: VNQ ) 4.2% SPDR DJ REIT (NYSEARCA: RWR ) 4.1% iShares DJ Total Market (NYSEARCA: IYY ) 1.0% If an investor is looking for modest growth in an area less tied to the economy, he/she may journey to the consumer staples segment or the health care sector. They are frequently identified as “non-cyclicals” since they represent things we need in good times and bad. And if an investor is looking for more total return in areas less tethered to economic well-being, he/she often travels to utilities and REITs. The exception to that rule? If rates are expected to rapidly rise across the yield curve, an investor would tend to shy away from the rate sensitivity associated with utilities and REITs. That’s not happening. In fact, the more the public is being told about the inevitability of rate increases, the greater the momentum for proxies like XLU and VNQ. The price-ratios for XLU:IYY as well as VNQ:IYY are at or near their highest points of 2014. I am not advocating that investors abandon economically sensitive stock assets let alone chase yield-sensitive stock segments. On the other hand, just as I recommended throughout 2014, I believe it makes sense to remain committed to longer-term bonds in funds like iShares 10-20 Year Treasury (NYSEARCA: TLH ) as well as lower volatility stocks across the sector spectrum. One of my largest client holdings, iShares USA Minimum Volatility (NYSEARCA: USMV ), is diversified across all of the economic sectors; the top 3 segments are health care, financials and information technology. What makes USMV particularly attractive in the current environment? The equities have lower volatility properties relative to the U.S. market at large, offering the possibility that losses during declining markets will be less dramatic. Similarly, gains in rising markets will emanate from exposure to strong economy stock sectors as well as weaker economy stock sectors. Click here for Gary’s latest podcast. Disclosure: Gary Gordon, MS, CFP is the president of Pacific Park Financial, Inc., a Registered Investment Adviser with the SEC. Gary Gordon, Pacific Park Financial, Inc, and/or its clients may hold positions in the ETFs, mutual funds, and/or any investment asset mentioned above. The commentary does not constitute individualized investment advice. The opinions offered herein are not personalized recommendations to buy, sell or hold securities. At times, issuers of exchange-traded products compensate Pacific Park Financial, Inc. or its subsidiaries for advertising at the ETF Expert web site. ETF Expert content is created independently of any advertising relationships.