Tag Archives: onload

How Strong Is SCHV? I’m Considering It As A Core Holding.

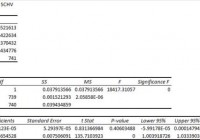
Summary I’m taking a look at SCHV as a candidate for inclusion in my ETF portfolio. The risk level is great, though the high correlation to SPY shouldn’t be a surprise. The ETF has fairly decent yields and a great composition of companies. I’m not assessing any tax impacts. Investors should check their own situation for tax exposure. Investors should be seeking to improve their risk adjusted returns. I’m a big fan of using ETFs to achieve the risk adjusted returns relative to the portfolios that a normal investor can generate for themselves after trading costs. I’m working on building a new portfolio and I’m going to be analyzing several of the ETFs that I am considering for my personal portfolio. One of the funds that I’m considering is the Schwab U.S. Large-Cap Value ETF (NYSEARCA: SCHV ). I’ll be performing a substantial portion of my analysis along the lines of modern portfolio theory, so my goal is to find ways to minimize costs while achieving diversification to reduce my risk level What does SCHV do? SCHV attempts to track the total return of the Dow Jones U.S. Large-Cap Value Total Stock Market Index. At least 90% of funds are invested in companies that are part of the index. SCHV falls under the category of “Large Value”. Does SCHV provide diversification benefits to a portfolio? Each investor may hold a different portfolio, but I use (NYSEARCA: SPY ) as the basis for my analysis. I believe SPY, or another large cap U.S. fund with similar properties, represents the reasonable first step for many investors designing an ETF portfolio. Therefore, I start my diversification analysis by seeing how it works with SPY. I start with an ANOVA table: (click to enlarge) The correlation is about 98%. That’s simply too high to provide a very meaningful diversification benefit. I measure risk with the standard deviation of daily returns. It isn’t perfect, but it works fairly well for my purposes and seems to hold up over time. Because the correlation is very high, the standard deviation of returns will be a fairly significant factor. Standard deviation of daily returns (dividend adjusted, measured since January 2012) The standard deviation is great. For SCHV it is 0.7027%. For SPY, it is 0.7300% for the same period. Since SPY usually beats other ETFs in this regard, I’d look at that standard deviation level as being fairly favorable. Of course, since SPY and SCHV hold several of the same companies a high correlation was pretty much a given. Since the Value side of the index should have more stability and less risk, the findings are in line with my expectations. Mixing it with SPY I also run comparisons on the standard deviation of daily returns for the portfolio assuming that the portfolio is combined with the S&P 500. For research, I assume daily rebalancing because it dramatically simplifies the math. With a 50/50 weighting in a portfolio holding only SPY and SCHV, the standard deviation of daily returns across the entire portfolio is 0.7128%. The value side of the index (which SCHV is tracking) has been outperformed by the growth side of the portfolio. I would expect that to usually happen during a bull market. When a bear market occurs, I would expect the value side to hold up a little better. Since I believe in being fairly defensive about protecting capital, the value side is more appealing to me. Why I use standard deviation of daily returns I don’t believe historical returns have predictive power for future returns, but I do believe historical values for standard deviations of returns relative to other ETFs have some predictive power on future risks and correlations. Yield & Taxes The distribution yield is 2.33%. The SEC 30 day yield is 2.52%. I’m pretty comfortable with this ETF as an investment for retirees so far. In my opinion, it is a fine investment for younger investors as well. I have quite a while to go before retirement, but I still like healthy dividend yielding companies. Investors concerned about tax consequences should seek advice from someone knowledgeable about their tax situation. Expense Ratio The ETF is posting .07% for an expense ratio. This is great expense ratio. I treat the expense ratio as a very important metric when considering an investment. I want diversification, I want stability, and I don’t want to pay for them. Market to NAV The ETF is at a .02% premium to NAV currently. In my opinion, that’s not worth worrying about. It is practically trading right on top of NAV. However, premiums or discounts to NAV can change very quickly so investors should check prior to putting in an order. Largest Holdings The portfolio isn’t really top heavy. There are no holdings over 4%, but I still could go for slightly more diversification. With so many companies over 2%, the low standard deviation speaks to the stability of the companies within the ETF. (click to enlarge) I love having Exxon Mobil (NYSE: XOM ) as the top holding in the portfolio. I want exposure to gas because high gas prices can slow down the rest of the economy. In my opinion, it is hard to make an argument for any portfolio (under modern portfolio theory) that does not contain at least some exposure to gas prices. In my opinion, XOM is a reasonably safe way to get that exposure. You may notice Chevron is also in there. I think that is great as well. I don’t want to hold just one of the major gas companies. In my opinion, this is a fairly solid lineup. I’m still uncomfortable with Verizon (NYSE: VZ ) because I don’t like that industry in the current environment. However, at less than 2%, I have no problem with including it in a long term ETF position. When the industry becomes attractive again, it should be a great company to hold. Conclusion I’m currently screening a large volume of ETFs for my own portfolio. The portfolio I’m building is through Schwab, so I’m able to trade SCHV with no commissions. I have a strong preference for researching ETFs that are free to trade in my account, so most of my research will be on ETFs that fall under the “ETF OneSource” program. I’m finding SCHV pretty attractive and will consider giving it a niche in my portfolio. The size of the position depends on if I decided to use it as a core holding in place of SPY or SCHB. In that scenario, it could end up with a position as large as 20 to 25%. Otherwise, I would probably aim for something around 10%. Before I make a final decision I’ll need to run some analysis on complete potential portfolios. One way or another, my complete portfolio will include strong exposures to large cap U.S. companies and to heavy dividend paying companies.
RiverPark Structural Alpha Fund, December 2014

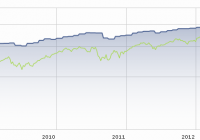
Editor’s note: Originally published on December 1, 2014 by David Snowball Objective and Strategy The RiverPark Structural Alpha Fund seeks long-term capital appreciation while exposing investors to less risk than broad stock market indices. The managers invest in a portfolio of listed and over-the-counter option spreads and short option positions that they believe structurally will generate exposure to equity markets with less volatility. They also maintain a short position against the broad stock market to hedge against a market decline and invest the majority of their assets in cash alternatives and high quality, short-term fixed income securities. Adviser RiverPark Advisors, LLC. RiverPark was formed in 2009 by former executives of Baron Asset Management. The firm is privately owned, with 84% of the company being owned by its employees. They advise, directly or through the selection of sub-advisers, the seven RiverPark funds. Overall assets under management at the RiverPark funds were over $3.5 billion as of September, 2014. Manager Jeremy Berman and Justin Frankel. The managers joined RiverPark in June 2013 when their Wavecrest Partners Fund was converted into the RiverPark Structural Alpha Fund. Prior to co-founding Wavecrest, Jeremy managed Morgan Stanley’s Structured Solutions group for eastern U.S.; prior to that he held similar positions at Bank of America and JP Morgan. Before RiverPark and Wavecrest, Mr. Frankel managed the Structured Investments business at Morgan Stanley. He began his career on the floor of the NYSE, became a market maker for a NASDAQ, helped Merrill Lynch grow their structured products business and served as a Private Wealth Advisor at UBS. They also graduated from liberal arts colleges (hah!). Strategy capacity and closure Something on the order for $3-5 billion. The derivatives market is “incredibly liquid,” so that the managers could accommodate substantially more assets by simply holding larger positions. Currently they have about 35 positions; by their calculation, a 100-fold increase in assets could be accommodated with a doubling of the number of positions. The unique nature of this market means that “more positions would decrease volatility without impinging returns. Given our portfolio structure, there’s no downside to growth.” Active share Not calculable for this sort of fund. Management’s stake in the fund Each of the managers has between $100,000 – 500,000 in the fund, as of the January 2014 Statement of Additional Information. RiverPark’s president is the fund’s single biggest shareholder; both he and the managers have been adding to their holdings lately. Two of the fund’s three trustees have substantial investments in the fund, which is particularly striking since they receive modest compensation for their work as trustees. In broad terms, they’ve invested hundreds of thousands more than they’ve received. We’d also like to compliment RiverPark for exemplary disclosure: the SEC allows funds to use “over $100,000” as the highest report for trustee ownership. RiverPark instead reports three higher bands: $100,000-500,000, $500,000-1 million, over $1 million. That’s really much more informative than the norm. Opening date June 28, 2013, though the preceding limited partnership launched on September 26, 2008. Minimum investment The minimum initial investment in the retail class is $1,000 and in the institutional class is $100,000. Expense ratio Retail class at 2.00% after waivers, institutional class at 1.75% after waivers, on total assets of $9.1 million. While that is high in comparison to traditional stock or bond funds, it’s competitive with other alt funds and cheap by hedge fund standards. If Wavecrest’s returns were recalculated assuming this expense structure, they’d be 2.0 – 2.5% higher than reported. Comments It’s time to get past having one five-word phrase, repeated out of context, define your understanding of an options-based strategy. In his 2002 letter , Warren Buffett described derivatives as (here are the five words): “financial weapons of mass destruction.” Set aside for the moment the fact that Buffett invests in derivatives and has made hundreds of millions of dollars from them and take time to read his original letter on the matter. His indictment was narrowly focused on uncollateralized positions and Buffett now has backed away from his earlier statement (“I don’t think they’re evil per se. It’s just, they, I mean there’s nothing wrong with having a futures contract or something of the sort”). His latest version of the warning is couched in terms of what happens to the derivatives market if there’s a nuclear strike or major biological weapons attack. I suspect that Messrs. Berman and Frankel would agree that, in the case of a nuclear attack, the derivatives market would be in trouble. As would the stock markets. And my local farmer’s market. Indeed, all of us would be in trouble. Structural Alpha is designed to address a far more immediate challenge: where should investors who are horrified by the prospects of the bond market but are already sufficiently exposed to the stock market turn for stable, credible returns? The managers believe that have found an answer which is grounded in one of the enduring characteristics of investor (read: “human”) psychology. We hate losing and we have an almost overwhelming fear of huge losses. That fear underlies our willingness to overpay for car, life, homeowners or health insurance for decades (the average U.S. house suffers one serious fire every 300 years, does that make you want to drop your fire coverage?) and is reflected in the huge compensation packages received by top insurance company executives (the average insurance CEO pockets $8 million/year, the CEO of Aetna (NYSE: AET ) took in $30 million). They make that money because risk is overpriced. Berman and Frankel found the same is true for volatility. Investors are willing to systematically overpay to manage the risks that make them most anxious. A carefully structured portfolio has allowed Structural Alpha and its predecessor limited partnership to benefit from that risk aversion, and to offer several distinctive advantages to their investors. Unlike an ETF or other passive product, this is not simply a mechanical collection of options. The portfolio has four complementary components whose weighting varies based on market conditions. Long-dated options which rise as the stock market does. The amount of the rise is capped, so that the fund trades away the prospect of capturing all of a bull market run in exchange for consistent returns in markets that are rising more normally. Short-dated options (called “straddles and strangles,” for reasons that are beyond me) which are essentially market neutral; they generate income and contribute to alpha in stable or range-bound markets. A short position against the stock market, designed to offset the portfolio’s exposure to market declines. A lot of high-quality, short-term fixed income products. Most of the fund’s portfolio is in cash, which serves as collateral on its options. Investing that cash carefully generates a modest, consistent stream of income. Over the better part of a full market cycle, the Structural Alpha strategy captured 80% of the stock index’s returns – the strategy gained about 70% while the S&P rose 87% – while largely sidestepping any sustained losses. On average, it captures about 20% of the market’s down market performance and 40% of its up market. The magic of compounding then works in their favor – by minimizing their losses in falling markets, they have little ground to make up when markets rally and so, little by little, they catch up with a pure equity portfolio. Here’s what that looks like: The blue line is Structural Alpha (you’ll notice it largely ignoring the 2008 crash) and the green line is the S&P 500. The dotted line is the point that Wavecrest became RiverPark. From inception, this strategy turned $10,000 into $16,700 with very low volatility while the S&P reached $19,600. The chart offers a pretty clear illustration of the managers’ goal: providing equity-like returns (around 9% annually) with fixed income-like volatility (around 30% of the stock market’s). There are two other claims worth considering: The fund benefits from market volatility, since the tendency to overpay rises as anxiety does. The fund benefits from rising interest rates, since its core strategies are uncorrelated with the bond market and its cash stash benefits from rising rates. Mr. Frankel notes that “if volatility and interest rates return to their historic means, it’s going to be a significant tailwind for us. That’s part of the reason we’re absolutely buying more shares for our own accounts.” That’s a rare combination. Bottom Line Fear causes us to act poorly. This is one of the few funds designed to allow you to use other’s fears to address your own. It seems to offer a plausible third path to reasonable returns, away from and independent of traditional but historically overpriced asset classes. Investors looking to lighten their bond exposure or dampen their equity portfolio owe it to consider Buffett’s actions rather than just his words. They should look closely here. Fund website RiverPark Structural Alpha. The managers lay out the research behind the strategy in The Benefits of Systematically Selling Volatility (2014), which is readable and well worth reading. If you’d like to listen to a précis of the strategy, they have a cute homemade video on the fund’s webpage. Start listening at about the 4:00 minute mark through to about 6:50. They make a complex strategy about as clear as anyone I’ve yet heard. The stuff before 4:00 is biography and the stuff afterward is legalese. Disclosure : No positions

When To Rebalance Your Portfolio

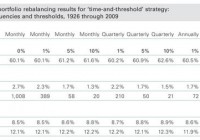
It’s that time of year again. Time to look at your portfolio and decide on your rebalancing strategy. Most investors know they should rebalance but many don’t do it or they get hung up on the detailed mechanics of rebalancing. In this post I’ll present a quick summary of rebalancing approaches and share my approach as well. We rebalance portfolios to improve risk adjusted returns over the long haul. In general, if portfolios are not rebalanced then the equity portion of the portfolio grows to dominate the overall portfolio and its risk. This is usually not something investors want especially as they age. After the decision to rebalance, the next question is how often. The frequency of rebalancing has to be traded off with the costs of rebalancing, transaction fees, commissions, etc… We also need to consider if we should rebalance if there is any difference at all in our target percentage allocations or wait until there is a significant enough difference to trigger an allocation decision. Say your target is 60% stocks and at the end the year you end up at 61% stocks. Does the benefit of rebalancing outweigh the costs? Probably not in this case. So, how does an investor choose the best approach? Fortunately, the great folks at Vanguard have done all the heavy lifting for us in this paper. Here is the summary table. (click to enlarge) As the above table shows basically there is not a big difference in rebalancing approaches, outside of never rebalancing. Even a monthly rebalance with a 0% threshold does not increase portfolio turnover and costs as much as you would expect. The last column also shows the results of never rebalancing – higher returns but with significantly higher volatility which leads to portfolio outcomes that most investors cannot stick with over time. These results also hold for quant portfolios. Whether implementing the IVY portfolios, the Permanent portfolios, Quant portfolios, the timing and threshold of the rebalance does not make a significant difference to long-term portfolio returns, e.g. see the IVY portfolio FAQ question #4. However, it is important to point out that there are periods where rebalancing does not work. Let me give you an example. The table below compares the returns of 60/40 stock bond and 70/30 stock bond portfolios with yearly rebalancing and no rebalancing over the last 5 years (2009 to 2013). (click to enlarge) As the table shows, yearly rebalancing increased returns for the 60/40 portfolio but yearly rebalancing actually decreased returns for the more aggressive 70/30 portfolio. This is typical in strong bull markets when stocks consistently outperform. This is maybe one of the reasons investors abandon rebalancing. But it is important to focus on the long term and more importantly on risk adjusted returns and stick to a rebalancing strategy. Personally, I rebalance once a year with a 1% threshold across all my portfolios regardless of strategy. But that is what I have found works for me. The best advice I can give anyone is to paraphrase the Vanguard advice – choose a regular periodic rebalancing approach that fits your investment style and that you can stick with over the long haul. This is most likely my last post for this year. Hope everyone has a Happy New Year! Here is to a great and prosperous 2015. At the beginning of the year I’ll be focusing on updating all the yearly returns for all the portfolios and strategies I track. I’m looking forward to sharing the results with everyone.