Tag Archives: onload

TrimTabs Plans 2 Free-Cash-Flow ETFs

TrimTabs ETF Trust has recently filed a post-effective amendment for two ETFs – one focusing on the domestic market and the other on international markets. The funds – TrimTabs International Free-Cash-Flow ETF and TrimTabs U.S. Free-Cash-Flow ETF – are expected to trade under the tickers FCFI and FCFD following their launch. Below, we have highlighted some of the details about the ETFs for investors seeking to know more about these in-registration funds: FCFI in Focus As per the SEC filing , the proposed passively managed ETF looks to provide exposure to international companies poised for rapid growth by tracking the performance of the TrimTabs International Free-Cash-Flow Index before fees and expenses. For this purpose, the index focuses on companies with high free cash flow yield, including REITs. Free cash flow here refers to the total cash generated by the company after spending the money required to maintain or expand its operations, while free cash flow yield is the ratio of a company’s free cash flow to its market capitalization. The index follows an equal weighted strategy which ensures a well-diversified portfolio. Moreover, the index seeks to provide exposure to 10 countries, including Australia, Canada, China, France, Germany, Japan, Korea, the Netherlands, Switzerland and the U.K. The fund will charge 69 basis points as fees. FCFD in Focus The proposed fund looks to track the performance of the TrimTabs U.S. Free-Cash-Flow Index, before fees and expenses. The passively managed fund focuses solely on U.S. companies, including REITs, having a high free cash flow yield. FCFD in short follows the same strategy as FCFI and also charges the same fees, but with a domestic focus. How Might it Fit in a Portfolio? Free cash flow is one of the important tools to measure the performance of a company. Usually most investors focus on fundamental indicators such as the price-to-earnings ratio (P/E), book value, price-to-book (P/B) and the PEG ratio to select companies with strong fundamentals. They often ignore free cash flow measures. However, the free cash flow yield offers a better representation of the company’s performance and in most cases give a fairer picture of the company than other fundamental measures. FCFI and FCFD, which focus on companies with high cash flow yield, are expected to hold some of the best performing international and domestic companies, respectively. ETF Competition Presently, there aren’t many funds focusing on this space. However, we have two funds from Cambria – one focused on the domestic space and the other on the international front – providing exposure to companies that generate high free cash flow and in turn look to return these to shareholders in the form of cash dividends, share repurchases, or by reducing their leverage. Cambria Shareholder Yield ETF (NYSEARCA: SYLD ) with an asset base of $218 million is based on the research that free cash flow is a key predictor of a company’s strength. This product invests in companies that show strong characteristics in returning free cash flow to their shareholders by way of cash dividends, share repurchases, or by reducing their leverage. The actively managed fund has a diversified portfolio of 104 stocks and charges 59 basis points as fees. Cambria Foreign Shareholder Yield ETF (NYSEARCA: FYLD ) on the other hand also works on the same proposition as SYLD, but focuses on stocks from foreign developed countries. The fund manages an asset base of $62.4 million and includes companies with the best combination of dividend payments and net stock buybacks. The fund charges the same fee as SYLD. Thus, FCFI and FCFD, if launched, have a fair chance of building assets for themselves, given the lack of competition in the space.
SPDR S&P MidCap 400 ETF: MDY’s 2014 And Fourth-Quarter Performance And Seasonality

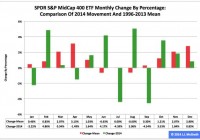
Summary The SPDR S&P MidCap 400 ETF ranked No. 2 in 2014 among the three most popular exchange traded funds based on the S&P 1500’s constituent indexes. Most recently, the ETF’s adjusted closing daily share price last month expanded to $263.97 from $261.79, an increase of $2.18, or 0.83 percent. Seasonality analysis shows the fund’s price accelerates in the fourth quarter of an average year, but decelerated in Q4 of last year. The SPDR S&P MidCap 400 Trust ETF (NYSEARCA: MDY ) ranked second by return during 2014 among the three most popular ETFs based on the S&P 1500’s constituent indexes, as it behaved worse than the SPDR S&P 500 Trust ETF (NYSEARCA: SPY ) and better than the iShares Core S&P Small-Cap ETF (NYSEARCA: IJR ). Measured by adjusted closing daily share prices, MDY climbed to $263.97 from $241.29, a hike of $22.68, or 9.40 percent. Accordingly, the middle-capitalization ETF underperformed the large-cap SPY by -4.06 percentage points and overperformed the small-cap IJR by 3.55 percentage points. Both seasonality and U.S Federal Reserve policy appear likely to be headwinds for MDY over the coming quarter. The Fed announced the end of asset purchases under its third formal quantitative easing program on October 29, 2014, and may announce the beginning of its next round of federal funds rate increases on April 29, 2015. The Fed’s conclusion of purchases under its first two formal QE programs this century is associated with bear markets in MDY , with the ETF slipping -21.16 percent in 2010 and -28.13 percent in 2011. Figure 1: MDY Monthly Change, 2014 Vs. 1996-2013 Mean (click to enlarge) Source: This J.J.’s Risky Business chart is based on analyses of adjusted closing monthly share prices at Yahoo Finance . MDY behaved a little worse in 2014 than it did during its initial 18 full years of existence, based on the monthly means calculated by employing data associated with that historical time frame (Figure 1). The same data set shows the average year’s weakest quarter was the third, with a relatively small negative return, and its strongest quarter was the fourth, with an absolutely large positive return. The ETF ran true to form overall in Q4 last year, but its share price decelerated rather than accelerated into 2015. Figure 2: MDY Monthly Change, 2014 Vs. 1996-2013 Median (click to enlarge) Source: This J.J.’s Risky Business chart is based on analyses of adjusted closing monthly share prices at Yahoo Finance. MDY performed much worse in 2014 than it did over its initial 18 full years of existence, based on the monthly medians calculated by using data associated with that historical time frame (Figure 2). The same data set shows the average year’s weakest quarter was the third, with a relatively small negative return, and its strongest quarter was the fourth, with an absolutely large positive return. Meanwhile, the latest figure generated by my proprietary U.S. Economic Index methodology and other multivariate analyses continue to indicate the metric may have hit either a long- or a short-term high level in August. As a result, I suspect American economic performance could soon join seasonality and Fed policy as a headwind for the equity market in general and for MDY in particular. Disclaimer: The opinions expressed herein by the author do not constitute an investment recommendation, and they are unsuitable for employment in the making of investment decisions. The opinions expressed herein address only certain aspects of potential investment in any securities and cannot substitute for comprehensive investment analysis. The opinions expressed herein are based on an incomplete set of information, illustrative in nature, and limited in scope. In addition, the opinions expressed herein reflect the author’s best judgment as of the date of publication, and they are subject to change without notice.

SPDR S&P 500 ETF: SPY’s 2014 And Fourth-Quarter Performance And Seasonality

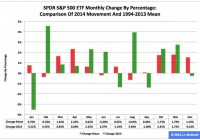
Summary The SPDR S&P 500 ETF ranked No. 1 in 2014 among the three most popular exchange-traded funds based on the S&P 1500’s constituent indexes. Most recently, the ETF’s adjusted closing daily share price last month declined to $205.54 from $206.06, a loss of -$0.52, or -0.25 percent. The last time the ETF had a negative return in the seasonally strong month of December was 2007. The SPDR S&P 500 ETF (NYSEARCA: SPY ) ranked first by return during 2014 among the three most popular ETFs based on the S&P 1500’s constituent indexes, which also encompass the SPDR S&P MidCap 400 ETF (NYSEARCA: MDY ) and the iShares Core S&P Small-Cap ETF (NYSEARCA: IJR ). SPY advanced to $205.54 from $181.15, a gain of $24.39, or 13.46 percent, in terms of adjusted closing daily share prices. Neither seasonality nor U.S Federal Reserve policy appears likely to be supportive of SPY at its current elevated level over the coming quarter. The Federal Open Market Committee announced the end of asset purchases under its third formal quantitative-easing program Oct. 29 and may announce the beginning of its next round of federal-funds-rate increases April 29. Figure 1: SPY Monthly Change, 2014 Vs. 1994-2013 Mean (click to enlarge) Source: This J.J.’s Risky Business chart is based on analyses of adjusted closing monthly share prices at Yahoo Finance . SPY behaved better in 2014 than it did over its initial 20 full years of existence based on the monthly means calculated by employing data associated with that historical time frame (Figure 1). The same data set shows the average year’s strongest quarter was the fourth, with an absolutely large positive return, and its weakest quarter was the third, with an absolutely small positive return. The last time the ETF had a negative return in the seasonally strong month of December was 2007. Figure 2: SPY Monthly Change, 2014 Vs. 1994-2013 Median (click to enlarge) Source: This J.J.’s Risky Business chart is based on analyses of adjusted closing monthly share prices at Yahoo Finance. SPY behaved worse in 2014 than it did over its initial 20 full years of existence based on the monthly medians calculated by using data associated with that historical time frame (Figure 2). The same data set shows the average year’s strongest quarter was the fourth, with an absolutely large positive return, and its weakest quarter was the third, with a relatively small positive return. Last year, the ETF performed best in the second quarter and worst in the third quarter. Disclaimer: The opinions expressed herein by the author do not constitute an investment recommendation, and they are unsuitable for employment in the making of investment decisions. The opinions expressed herein address only certain aspects of potential investment in any securities and cannot substitute for comprehensive investment analysis. The opinions expressed herein are based on an incomplete set of information, illustrative in nature, and limited in scope. In addition, the opinions expressed herein reflect the author’s best judgment as of the date of publication, and they are subject to change without notice. Now that you’ve read this, are you Bullish or Bearish on ? Bullish Bearish Sentiment on ( ) Thanks for sharing your thoughts. Why are you ? Submit & View Results Skip to results » Share this article with a colleague