Tag Archives: onload

Zacks’ Bear Of The Day: EQT Corporation

Many investors have been focused in on the oil crash of 2014 as prices for the important commodity have basically been halved in the year. Yet many investors might not realize that even with a chilly start to 2015 across much of the nation, natural gas prices remain subdued as well. In fact, natural gas prices trading on the NYMEX have crashed in just the past two months with prices tumbling from $4.60 to their current level right around the $3.00 mark. This represents a dramatic 35% loss in basically just the past six weeks, and even winter seems to be doing very little to boost prices in the near term and save this commodity from further losses. As you might expect given these terrible trends, natural gas-focused stocks have also been having a very rough time, much like their oil-driven peers. A great example of this trend, and a company that you should probably continue to avoid in 2015, comes to us from Pennsylvania with EQT Corporation (NYSE: EQT ) . EQT in Focus This Pittsburgh-based company focuses on exploring for and producing various hydrocarbon resources in the Appalachian Basin. The company also has a midstream division as well, which helps to get natural gas and other energy resources out of the fields and further downstream to refiners and other processors. This business has actually been a pretty solid one to be in over the past half decade as EQT was actually putting up a very nice performance. The stock was actually beating out the S&P 500 on a five year look until this past December when the energy crash finally caught up to EQT and pushed the stock down roughly 25% over the past six months of 2014. Some might think that the worst is over for this company, and especially so if energy prices can find a new equilibrium in the near term. But if you look to recent analyst estimate revisions for EQT’s earnings, you’ll see that more trouble may be ahead for this stock and that you should probably hold-off on trying to catch this falling knife to start 2015. Recent Estimate Revisions Not a single analyst has stepped up to the plate and raised their earnings estimates for EQT in the past sixty days. Instead, all of the new estimates have been lower for EQT, including five lower for the current year in the past two months. This has had a dramatic impact on the full year consensus estimate for EQT as this has plunged from $3.50/share 90 days ago to just $3.13/share today. We have seen a similar trend for the next year time frame, as estimates here have fallen by 20% in the period, suggesting that analysts do not see a turnaround coming in the near future. For these reasons, we have assigned EQT a Zacks Rank #5 (Strong Sell) and are looking for more underperformance from this company to start 2015, and especially so if energy prices remain subdued. Other Picks? The oil exploration and production industry is having a very difficult time right now thanks to the macro environment. This leaves the industry with a rank that is in the bottom 10% overall, suggesting that there are far better choices out there for investors. However, if you are dead set on the oil E&P space, you might want to consider LRR Energy (NYSE: LRE ) instead. This company currently has a Zacks Rank #2 (Buy), while it just saw a great earnings beat and a huge surge in analyst estimates for the company’s upcoming earnings. This may make LRE a better choice in the space for investors right now, or at least an arguably more favorable pick than EQT for the time being.
ETFs For The Unquestioned ‘Wall Of Worry’

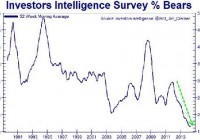
Wall Street stocks often climb in the face of negativity, pessimism and rational fears. With the Fed ending its electronic money printing in the U.S. while hinting at raising overnight lending rates, a continuation of the stock uptrend requires fuel from elsewhere. For now, the bond “wall of worry” and the “stock wall of worry” are not as important as the definitive uptrends for the assets. The crises of yesteryear almost seem quaint. Did investors really need to fret the possibility of the world’s 44th economy (Greece) exiting the euro-zone back in 2011? The stock market ultimately prevailed. Why did the fiscal cliff, sequestration and government shutdown concerns cause so much anxiety in 2012? U.S. stocks eventually powered ahead by roughly 14% that year. Discussion in 2013 of the Federal Reserve tapering its bond purchases in 2014? Please. Equities not only handled the notion of Fed stimulus ending, they knocked doubters on their backsides with two additional years of double-digit percentage gains. Indeed, Wall Street stocks often climb in the face of negativity, pessimism and rational fears. That is what bull markets are made of. On the other hand, when the investing community no longer worries – when the overwhelming majority of participants have no expectation of loss – dreams of risk-free wealth often turn to nightmares. Consider the chart below. The Investors Intelligence Survey’s percentage of self-described bears – those who believe the market will drop – has declined steadily over the last three years. It sits at the lowest level ever. And why not? U.S. stocks have rocketed ahead for three consecutive calendar cycles without so much as a 10% pullback. If every 4%-8% downward movement becomes a “buy-the-dip” opportunity – if people cannot recall the odious feelings associated with a correction of 10%-19% – they’re more likely to chalk up a bearish decline of 30%-plus as an aberration. Trillions in electronic currency creation, zero percent rate policy, corporate stock buybacks, margin debt, carry trade activity, a quest for yield as well as signs of domestic economic improvement have contributed to the amazing six-year performance for U.S. stocks. Of course, none of these things occurred independently. With the Fed ending its electronic money printing in the U.S. while hinting at raising overnight lending rates, a continuation of the stock uptrend requires fuel from elsewhere. Perhaps literally. Unfortunately, and yes, I do mean unfortunately, collapsing oil prices are not a windfall for the U.S. economy. Since 2009, employment in the oil industry has soared by as much as 50%. I have seen reports that energy jobs accounted for 40% of the national job growth since 2000. And these are high-paying careers that we are talking about, as opposed to the low-paying nature of retail, health service professionals and part-time work. The rapid descent in oil prices is a signal of a weakening global economy. Either we see the rest of the globe lose its fight against deflation, eventually dragging the U.S. down with it, or oil prices revert back to a spot price near $75 per barrel and stabilize the world order. I believe the latter is more probable. In fact, if oil fails to find a base that the world and the U.S. energy industry can live with, I believe the Fed will push off its rate normalization plans into the fall or wintertime. (More stimulus, more easy money… that will power stocks in 2015, right?) Indeed, I am long Exxon Mobil (NYSE: XOM ) as a dividend aristocrat that will benefit from greater oil price stability. And while client portfolios stopped out of a profitable position in UBS MLP Alerian Infrastructure (NYSEARCA: MLPI ) back in October, I may revisit the theme of energy infrastructure in the near future. If any sector could benefit from an unquestioned ascent on a “wall of worry,” it could be energy. Or, in contrast, energy could supplant the tech sector circa 2000-2002 and the financial sector circa 2007-2009. A great deal would depend on how Fed policy acts in the face of domestic and global economic deceleration. Will it be the dovish Fed that has maintained zero percent interest rates throughout the six-year bull market? Or will it be a more determined Fed that wants to give itself more breathing room by raising short-term rates, so that it does not need to sign on for QE4? Regardless, investors that have been suckered in by endless promises of rising interest rates need to recognize the unanimous refrain is almost always incorrect. Last year’s Bloomberg poll of the top 55 economists found that all 55 expect the 10-year yield to rise from 3.0%. The average forecast? 3.4%. Only a few folks like myself pointed to the relative value of U.S. treasuries compared with lesser quality sovereign debt abroad as well as the global economic slowdown. As we all know now, the 10-year fell to 2.2% from 3.0%. The economists are at it again. Nearly all of them say the 10-year yield will go higher, with an average forecast of 3.0% by 2015 year-end. I think the 10-year yield will probably be closer to 2%, especially with comparable German bunds below 1% and Japanese government 10-year bonds at 0.31%. Just like last year, I am quite content to keep utilizing longer-duration treasuries in funds like Vanguard Long Term Government Bond (NASDAQ: VGLT ) as well as iShares 10-20 Year Treasury (NYSEARCA: TLH ), as the yield curve continues to compress. Most of my clients have exposure to Vanguard Extend Duration (NYSEARCA: EDV ), though I would look for a bit of a shakedown before considering the longest end of the curve. Bottom line? Check your bond bearishness and stock bullishness at the door. Let the trendlines do the talking for both assets. For now, the bond “wall of worry” and the “stock wall of worry” are not as important as the definitive uptrends for the assets. One should let the uptrends in a stock stalwart like iShares USA Minimum Volatility (NYSEARCA: USMV ) as well as a bond winner like Vanguard Long Term Government ( VGLT ) speak for themselves. Disclosure: Gary Gordon, MS, CFP is the president of Pacific Park Financial, Inc., a Registered Investment Adviser with the SEC. Gary Gordon, Pacific Park Financial, Inc, and/or its clients may hold positions in the ETFs, mutual funds, and/or any investment asset mentioned above. The commentary does not constitute individualized investment advice. The opinions offered herein are not personalized recommendations to buy, sell or hold securities. At times, issuers of exchange-traded products compensate Pacific Park Financial, Inc. or its subsidiaries for advertising at the ETF Expert web site. ETF Expert content is created independently of any advertising relationships.

iPath Natural Gas ETN Is A Broken Product

ETF and ETN investors should avoid broken products. I have repeated this caution numerous times over the years. Upon hearing this warning, most investors want to know what a broken product is. Once they understand the definition, they quickly grasp the danger. ETFs and ETNs are unique securities. The primary feature that differentiates them from other investment vehicles is the ability to create and redeem shares, typically through an in-kind exchange process. Another key feature is the publishing of the underlying portfolio’s value throughout the trading day. The two features combined allow market makers to keep the trading price very close to the value (often called the Intraday Value or the iNAV). This is the “promise” behind ETFs and ETNs, and investors expect these products to live up to it. However, sometimes the share creation mechanism is suspended or terminated for a given product, and that is when it becomes a broken product. Without a viable share creation process, an ETF or ETN can trade like a closed-end fund with price premiums. The typical retail investor does not have an easy way of knowing if a product is broken or not, and that is where the danger lies. It could be trading at a substantial premium, a premium that could disappear instantly. This is not just a theoretical problem; it is very real and happening today. You are probably aware that crude oil prices have been falling for a number of months. More recently, natural gas prices plunged. ETFs and ETNs tracking natural gas fell right along with the underlying commodity. Last week, the United States Natural Gas Fund (NYSEARCA: UNG ) dropped 12.5%. The leveraged ProShares Ultra Bloomberg Natural Gas ETF (NYSEARCA: BOIL ) was whacked for a 22.6% loss. However, the iPath DJ-UBS Natural Gas Total Return Sub-Index ETN (NYSEARCA: GAZ ), an unleveraged product tracking the same index as BOIL, gained 5.9%. The reason for this is because GAZ is a broken product. On August 21, 2009, Barclays “temporarily suspended” the creation unit process for GAZ . More than five years later it is still suspended, straining the credibility of the word temporarily. I’m willing to bet most investors are unaware GAZ is broken. Without the ability to create and redeem units of GAZ, it is impossible for market makers to keep the trading price near the net asset value (“NAV”). The NAV of GAZ went from $1.9182 to $1.5874 per unit last week, a plunge of 17.2%. The price went the other way, increasing from $2.02 to $2.14. GAZ started the week trading at a 5.3% premium and closed with a 34.8% premium. The premium narrowed slightly earlier this week, but it was more than 36% at the close on Wednesday. Anyone buying GAZ today is far more than it is worth. This is not a traditional liquidity problem, as GAZ has averaged more than 100,000 shares a day recently. This high volume suggests that many participants are unaware of its broken product status. One day, regulators may require investors be informed they are buying a broken product by requiring a ticker symbol suffix or some other means. Until then, be careful out there, and don’t get caught owning a broken product when the premium disappears . Disclosure covering writer, editor, and publisher: No positions in any of the securities mentioned. No positions in any of the companies or ETF sponsors mentioned. No income, revenue, or other compensation (either directly or indirectly) received from, or on behalf of, any of the companies or ETF sponsors mentioned.